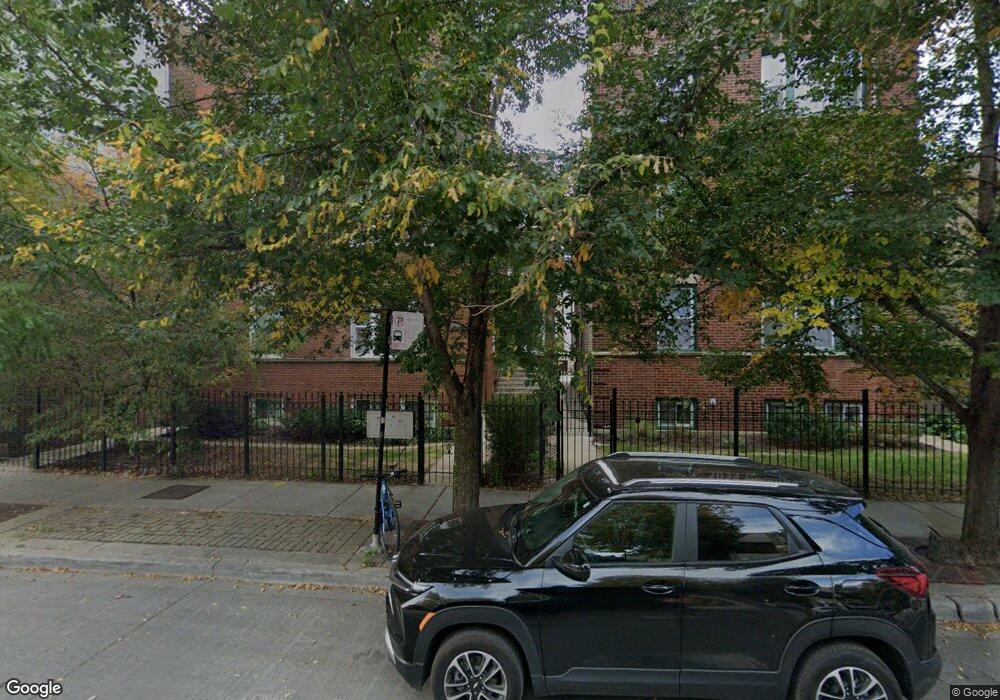
2103 W Lawrence Ave Unit 21033 Chicago, IL 60625
Ravenswood NeighborhoodEstimated Value: $270,977 - $344,000
1
Bed
1
Bath
8,000
Sq Ft
$39/Sq Ft
Est. Value
About This Home
This home is located at 2103 W Lawrence Ave Unit 21033, Chicago, IL 60625 and is currently estimated at $309,494, approximately $38 per square foot. 2103 W Lawrence Ave Unit 21033 is a home located in Cook County with nearby schools including McPherson Elementary School, Amundsen High School, and Lycee Francais de Chicago.
Ownership History
Date
Name
Owned For
Owner Type
Purchase Details
Closed on
Jun 28, 2023
Sold by
Fagan Lisa and Fagan William Michael
Bought by
Fagan Living Trust
Current Estimated Value
Purchase Details
Closed on
Apr 7, 2018
Sold by
Schwerman Jay and Schwerman Christian
Bought by
Fagan William M and Fagan Lisa
Home Financials for this Owner
Home Financials are based on the most recent Mortgage that was taken out on this home.
Original Mortgage
$202,500
Interest Rate
4.44%
Mortgage Type
New Conventional
Purchase Details
Closed on
Nov 14, 2008
Sold by
Carmona Jose Antonio
Bought by
Oberneufemann Christian
Home Financials for this Owner
Home Financials are based on the most recent Mortgage that was taken out on this home.
Original Mortgage
$211,280
Interest Rate
6.48%
Mortgage Type
Purchase Money Mortgage
Create a Home Valuation Report for This Property
The Home Valuation Report is an in-depth analysis detailing your home's value as well as a comparison with similar homes in the area
Home Values in the Area
Average Home Value in this Area
Purchase History
| Date | Buyer | Sale Price | Title Company |
|---|---|---|---|
| Fagan Living Trust | -- | None Listed On Document | |
| Fagan William M | $225,000 | Proper Title Llc | |
| Oberneufemann Christian | $222,500 | Chicago Title Insurance Co |
Source: Public Records
Mortgage History
| Date | Status | Borrower | Loan Amount |
|---|---|---|---|
| Previous Owner | Fagan William M | $202,500 | |
| Previous Owner | Oberneufemann Christian | $211,280 |
Source: Public Records
Tax History Compared to Growth
Tax History
| Year | Tax Paid | Tax Assessment Tax Assessment Total Assessment is a certain percentage of the fair market value that is determined by local assessors to be the total taxable value of land and additions on the property. | Land | Improvement |
|---|---|---|---|---|
| 2024 | $4,365 | $26,981 | $7,184 | $19,797 |
| 2023 | $4,253 | $20,001 | $5,799 | $14,202 |
| 2022 | $4,253 | $20,001 | $5,799 | $14,202 |
| 2021 | $4,156 | $19,999 | $5,798 | $14,201 |
| 2020 | $4,760 | $20,677 | $3,092 | $17,585 |
| 2019 | $4,727 | $22,706 | $3,092 | $19,614 |
| 2018 | $3,934 | $22,706 | $3,092 | $19,614 |
| 2017 | $3,946 | $21,000 | $2,705 | $18,295 |
| 2016 | $3,862 | $21,000 | $2,705 | $18,295 |
| 2015 | $3,515 | $21,000 | $2,705 | $18,295 |
| 2014 | $3,204 | $19,084 | $2,077 | $17,007 |
| 2013 | $3,058 | $19,084 | $2,077 | $17,007 |
Source: Public Records
Map
Nearby Homes
- 4814 N Damen Ave Unit 209
- 4726 N Winchester Ave Unit C
- 4726 N Winchester Ave Unit F
- 2224 W Eastwood Ave
- 4906 N Winchester Ave
- 2248 W Ainslie St
- 2163 W Windsor Ave
- 4938 N Bell Ave
- 2034 W Sunnyside Ave
- 4948 N Winchester Ave
- 1949 W Argyle St Unit 19491
- 4909 N Wolcott Ave Unit 2B
- 5015 N Damen Ave
- 4545 N Wolcott Ave Unit 1
- 4751 N Artesian Ave Unit 205
- 4929 N Wolcott Ave Unit 1A
- 4947 N Wolcott Ave Unit 1B
- 5401-5447 N Wolcott Ave
- 4745 N Ravenswood Ave Unit 210
- 4519 N Western Ave
- 2103 W Lawrence Ave Unit P4
- 2103 W Lawrence Ave Unit P3
- 2103 W Lawrence Ave Unit P2
- 2103 W Lawrence Ave Unit P1
- 2103 W Lawrence Ave Unit 21032
- 2103 W Lawrence Ave Unit 21031
- 2103 W Lawrence Ave Unit 3
- 2103 W Lawrence Ave Unit 2
- 2103 W Lawrence Ave Unit 1
- 2101 W Lawrence Ave Unit 21013
- 2101 W Lawrence Ave Unit 21012
- 2101 W Lawrence Ave Unit 21011
- 2101 W Lawrence Ave Unit 3
- 2101 W Lawrence Ave Unit 2
- 2101 W Lawrence Ave Unit 1N
- 2101 W Lawrence Ave Unit 1
- 2105 W Lawrence Ave Unit 7
- 2109 W Lawrence Ave
- 2115 W Lawrence Ave
- 4753 N Hamilton Ave Unit 3