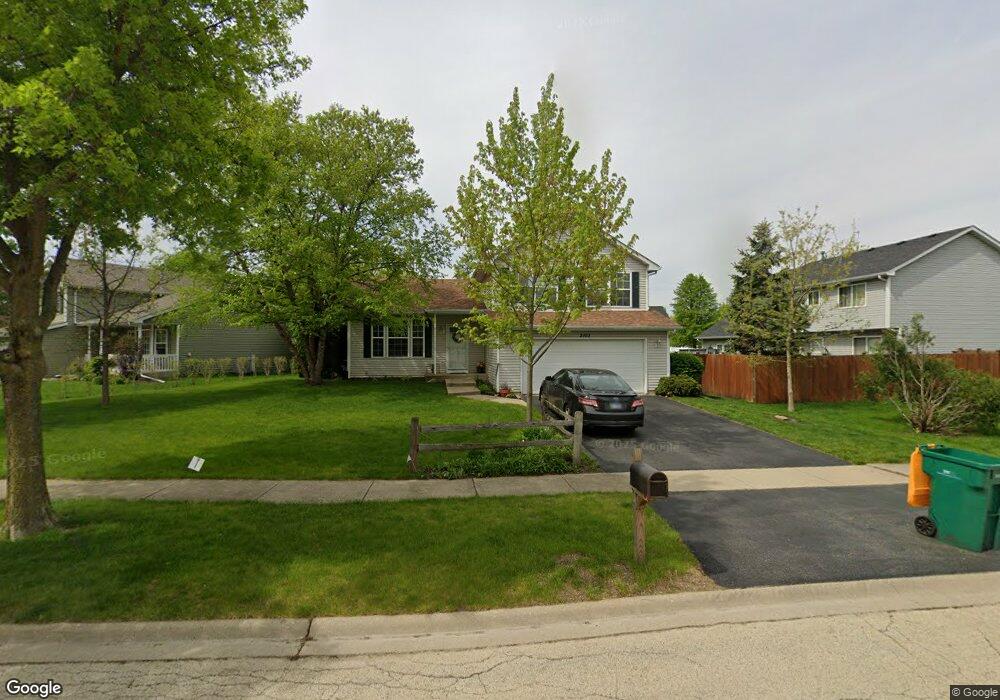
2103 Windcrest Ln Joliet, IL 60431
Southwest Joliet NeighborhoodEstimated Value: $305,884 - $366,000
3
Beds
3
Baths
1,645
Sq Ft
$208/Sq Ft
Est. Value
About This Home
This home is located at 2103 Windcrest Ln, Joliet, IL 60431 and is currently estimated at $342,721, approximately $208 per square foot. 2103 Windcrest Ln is a home located in Will County with nearby schools including Grand Prairie Elementary School, Timber Ridge Middle School, and Plainfield Central High School.
Ownership History
Date
Name
Owned For
Owner Type
Purchase Details
Closed on
Sep 20, 2004
Sold by
Hopper Lisa Marie and Udziela Lisa Marie
Bought by
Rand Tanya M
Current Estimated Value
Home Financials for this Owner
Home Financials are based on the most recent Mortgage that was taken out on this home.
Original Mortgage
$148,000
Outstanding Balance
$73,372
Interest Rate
5.89%
Mortgage Type
Purchase Money Mortgage
Estimated Equity
$269,349
Purchase Details
Closed on
Apr 30, 2000
Sold by
Hopper Victor and Hopper Lisa
Bought by
Hopper Lisa Marie and Udziela Lisa Marie
Purchase Details
Closed on
Apr 13, 1999
Sold by
Nlsb
Bought by
Hopper Victor L and Udziela Lisa M
Home Financials for this Owner
Home Financials are based on the most recent Mortgage that was taken out on this home.
Original Mortgage
$139,520
Interest Rate
7.17%
Mortgage Type
FHA
Create a Home Valuation Report for This Property
The Home Valuation Report is an in-depth analysis detailing your home's value as well as a comparison with similar homes in the area
Home Values in the Area
Average Home Value in this Area
Purchase History
| Date | Buyer | Sale Price | Title Company |
|---|---|---|---|
| Rand Tanya M | $185,000 | -- | |
| Hopper Lisa Marie | -- | -- | |
| Hopper Victor L | $134,000 | -- |
Source: Public Records
Mortgage History
| Date | Status | Borrower | Loan Amount |
|---|---|---|---|
| Open | Rand Tanya M | $148,000 | |
| Previous Owner | Hopper Victor L | $139,520 | |
| Closed | Hopper Victor L | $5,580 |
Source: Public Records
Tax History
| Year | Tax Paid | Tax Assessment Tax Assessment Total Assessment is a certain percentage of the fair market value that is determined by local assessors to be the total taxable value of land and additions on the property. | Land | Improvement |
|---|---|---|---|---|
| 2024 | $6,288 | $95,796 | $20,407 | $75,389 |
| 2023 | $6,288 | $86,521 | $18,431 | $68,090 |
| 2022 | $5,545 | $76,616 | $16,554 | $60,062 |
| 2021 | $5,251 | $71,604 | $15,471 | $56,133 |
| 2020 | $5,168 | $69,572 | $15,032 | $54,540 |
| 2019 | $4,983 | $66,291 | $14,323 | $51,968 |
| 2018 | $4,762 | $62,283 | $13,457 | $48,826 |
| 2017 | $4,613 | $59,187 | $12,788 | $46,399 |
| 2016 | $4,514 | $56,449 | $12,196 | $44,253 |
| 2015 | $4,198 | $52,880 | $11,425 | $41,455 |
| 2014 | $4,198 | $51,013 | $11,022 | $39,991 |
| 2013 | $4,198 | $51,013 | $11,022 | $39,991 |
Source: Public Records
Map
Nearby Homes
- 2258 Graystone Dr Unit 7340
- 1959 Timberview Dr
- 1814 Addleman St
- 1944 Timbers Edge Cir
- 1811 Brockway Pond Ct
- 2410 Nuclear Dr
- 2408 Meridian Dr
- 3709 Squires Mill Rd
- 1945 Calla Dr
- 1935 Calla Dr
- 2153 Sandhill Ct
- 2151 Sandhill Ct
- 2150 Sandhill Ct
- 2154 Sandhill Ct
- 3010 Old Castle Rd
- 3008 Old Castle Rd
- 3006 Old Castle Rd
- 3009 Vimy Ridge Dr
- 3004 Old Castle Rd
- 3002 Old Castle Rd
- 2101 Windcrest Ln
- 3508 September Dr
- 2013 Windcrest Ln
- 2012 September Ct
- 3510 September Dr
- 2104 Windcrest Ln
- 2102 Windcrest Ln Unit 2
- 2106 Windcrest Ln
- 2100 Windcrest Ln
- 2011 Windcrest Ln
- 2012 Windcrest Ln Unit 2
- 3509 September Dr
- 3507 September Dr
- 2010 September Ct
- 3511 September Dr
- 3505 September Dr
- 2009 Windcrest Ln
- 2010 Windcrest Ln
- 2109 Graystone Dr
- 2111 Graystone Dr
Your Personal Tour Guide
Ask me questions while you tour the home.