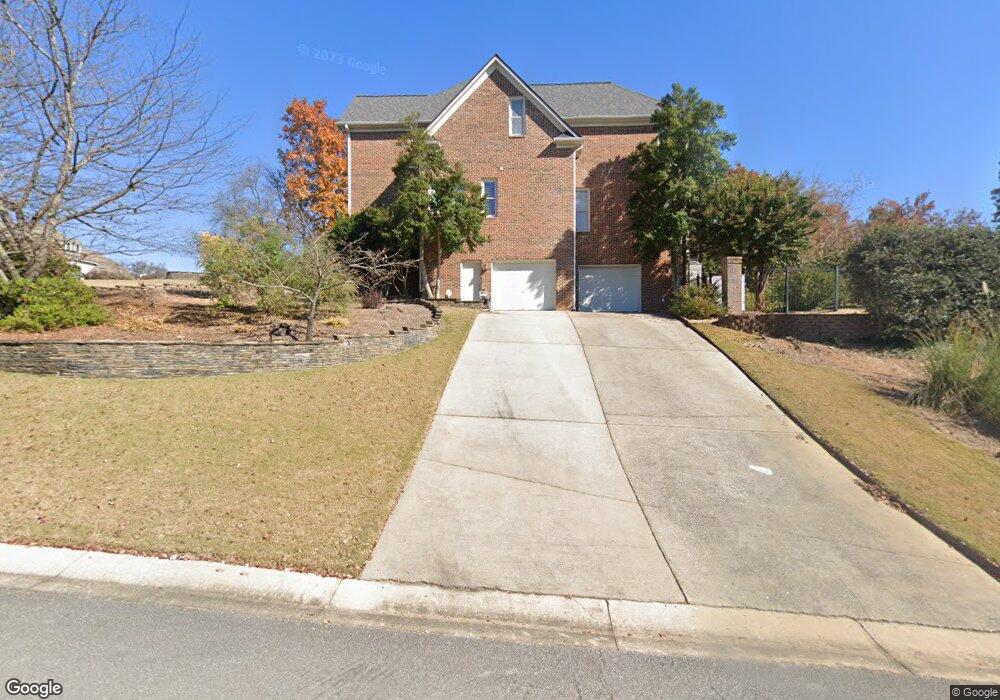
2104 Brook Highland Ridge Birmingham, AL 35242
Estimated Value: $952,000 - $1,105,000
5
Beds
6
Baths
4,612
Sq Ft
$218/Sq Ft
Est. Value
About This Home
This home is located at 2104 Brook Highland Ridge, Birmingham, AL 35242 and is currently estimated at $1,004,655, approximately $217 per square foot. 2104 Brook Highland Ridge is a home located in Shelby County with nearby schools including Inverness Elementary School, Oak Mountain Intermediate School, and Oak Mt. Middle School.
Ownership History
Date
Name
Owned For
Owner Type
Purchase Details
Closed on
Dec 3, 2009
Sold by
Smith Lynda M and Smith Arthur T
Bought by
Helton Stanley R and Helton Doran C
Current Estimated Value
Home Financials for this Owner
Home Financials are based on the most recent Mortgage that was taken out on this home.
Original Mortgage
$417,000
Outstanding Balance
$273,106
Interest Rate
4.98%
Mortgage Type
New Conventional
Estimated Equity
$731,549
Purchase Details
Closed on
Dec 23, 2003
Sold by
Smith Arthur T and Smith Lynda M
Bought by
Smith Lynda M
Purchase Details
Closed on
Sep 17, 1999
Sold by
Bennett Norman P and Bennett Karen
Bought by
Smith Arthur T and Smith Lynda M
Home Financials for this Owner
Home Financials are based on the most recent Mortgage that was taken out on this home.
Original Mortgage
$337,400
Interest Rate
8.22%
Create a Home Valuation Report for This Property
The Home Valuation Report is an in-depth analysis detailing your home's value as well as a comparison with similar homes in the area
Home Values in the Area
Average Home Value in this Area
Purchase History
| Date | Buyer | Sale Price | Title Company |
|---|---|---|---|
| Helton Stanley R | $525,000 | None Available | |
| Smith Lynda M | -- | -- | |
| Smith Arthur T | $482,001 | -- |
Source: Public Records
Mortgage History
| Date | Status | Borrower | Loan Amount |
|---|---|---|---|
| Open | Helton Stanley R | $417,000 | |
| Closed | Smith Arthur T | $337,400 |
Source: Public Records
Tax History Compared to Growth
Tax History
| Year | Tax Paid | Tax Assessment Tax Assessment Total Assessment is a certain percentage of the fair market value that is determined by local assessors to be the total taxable value of land and additions on the property. | Land | Improvement |
|---|---|---|---|---|
| 2024 | $3,513 | $79,840 | $0 | $0 |
| 2023 | $3,396 | $78,120 | $0 | $0 |
| 2022 | $3,295 | $75,820 | $0 | $0 |
| 2021 | $2,962 | $68,240 | $0 | $0 |
| 2020 | $2,807 | $64,720 | $0 | $0 |
| 2019 | $2,980 | $68,660 | $0 | $0 |
| 2017 | $2,700 | $62,300 | $0 | $0 |
| 2015 | $2,575 | $59,460 | $0 | $0 |
| 2014 | $2,513 | $58,040 | $0 | $0 |
Source: Public Records
Map
Nearby Homes
- 2096 Brook Highland Ridge
- 2080 Brook Highland Ridge
- 2076 Brook Highland Ridge
- 4227 Ashington Dr
- 1010 Warrington Cir
- 3100 Somerset Trace
- 1645 Wingfield Dr
- 3071 Somerset Trace
- 1616 Wingfield Trace
- 3212 Brook Highland Trace
- 3213 Brook Highland Trace
- 225 Courtside Dr
- 2552 Magnolia Place
- 243 Courtside Dr Unit 45
- 2047 Stone Brook Dr
- 2039 Stone Brook Dr
- 5330 Meadowlark Ln
- 1770 Portobello Rd
- 905 Barristers Ct
- 24105 Portobello Rd Unit 105
- 2112 Brook Highland Ridge
- 2100 Brook Highland Ridge
- 2109 Brook Highland Ridge
- 2113 Brook Highland Ridge
- 2116 Brook Highland Ridge
- 2105 Brook Highland Ridge
- 1004 Ridge Cir
- 2117 Brook Highland Ridge
- 2101 Brook Highland Ridge
- 1020 Ridge Cir
- 2120 Brook Highland Ridge
- 2092 Brook Highland Ridge
- 2092 Brook Highland Ridge
- 2097 Brook Highland Ridge
- 2121 Brook Highland Ridge
- 2124 Brook Highland Ridge
- 1005 Ridge Cir
- 2088 Brook Highland Ridge
- 2093 Brook Highland Ridge
- 1009 Ridge Cir