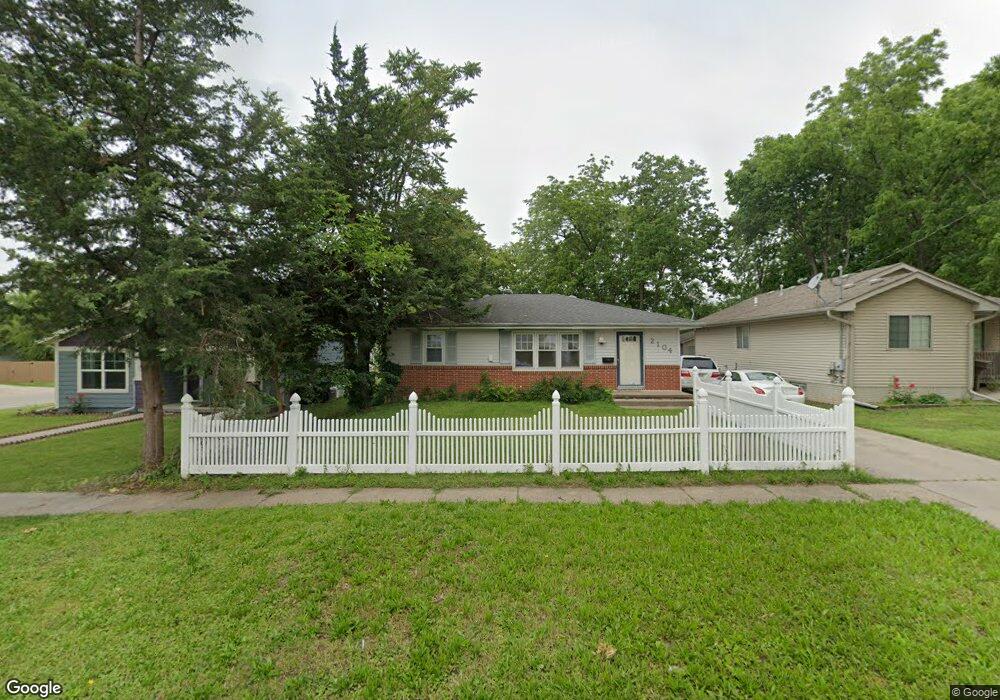
2104 E 23rd St Des Moines, IA 50317
Fairmont Park NeighborhoodEstimated Value: $191,000 - $229,000
2
Beds
2
Baths
816
Sq Ft
$267/Sq Ft
Est. Value
About This Home
This home is located at 2104 E 23rd St, Des Moines, IA 50317 and is currently estimated at $217,813, approximately $266 per square foot. 2104 E 23rd St is a home located in Polk County with nearby schools including Phillips Elementary, Goodrell Middle School, and North High School.
Ownership History
Date
Name
Owned For
Owner Type
Purchase Details
Closed on
Feb 17, 2006
Sold by
Watson Eugene M and Bridges Watson Helia V
Bought by
Phongsrisattanack Pranee
Current Estimated Value
Home Financials for this Owner
Home Financials are based on the most recent Mortgage that was taken out on this home.
Original Mortgage
$108,000
Interest Rate
6.73%
Mortgage Type
Purchase Money Mortgage
Create a Home Valuation Report for This Property
The Home Valuation Report is an in-depth analysis detailing your home's value as well as a comparison with similar homes in the area
Home Values in the Area
Average Home Value in this Area
Purchase History
| Date | Buyer | Sale Price | Title Company |
|---|---|---|---|
| Phongsrisattanack Pranee | $134,500 | Itc |
Source: Public Records
Mortgage History
| Date | Status | Borrower | Loan Amount |
|---|---|---|---|
| Open | Phongsrisattanack Pranee | $27,000 | |
| Previous Owner | Phongsrisattanack Pranee | $108,000 |
Source: Public Records
Tax History
| Year | Tax Paid | Tax Assessment Tax Assessment Total Assessment is a certain percentage of the fair market value that is determined by local assessors to be the total taxable value of land and additions on the property. | Land | Improvement |
|---|---|---|---|---|
| 2025 | $3,772 | $230,500 | $26,200 | $204,300 |
| 2024 | $3,772 | $202,200 | $22,700 | $179,500 |
| 2023 | $3,422 | $202,200 | $22,700 | $179,500 |
| 2022 | $3,394 | $154,100 | $17,900 | $136,200 |
| 2021 | $3,204 | $154,100 | $17,900 | $136,200 |
| 2020 | $3,324 | $137,000 | $15,900 | $121,100 |
| 2019 | $2,888 | $137,000 | $15,900 | $121,100 |
| 2018 | $2,854 | $116,000 | $13,200 | $102,800 |
| 2017 | $2,834 | $116,000 | $13,200 | $102,800 |
| 2016 | $2,756 | $113,300 | $12,600 | $100,700 |
| 2015 | $2,756 | $113,300 | $12,600 | $100,700 |
| 2014 | $2,716 | $115,000 | $12,600 | $102,400 |
Source: Public Records
Map
Nearby Homes
- 1901 E 23rd St
- 1821 E 25th St
- 2208 Tichenor St
- 2113 E 21st St
- 2503 E 24th St
- 2539 E 23rd St
- 2520 E 25th St
- 2700 Hubbell Ave
- 1517 Delaware Ave
- 2654 Wisconsin Ave
- 1410 E 23rd St
- 2670 Wisconsin Ave
- 2114 Boyd St
- 2710 E Washington Ave
- 1529 E 19th St
- 1415 Delaware Ave
- 2757 Easton Blvd
- 1321 E 25th St
- 1411 Delaware Ave
- 2612 Grandview Ave
Your Personal Tour Guide
Ask me questions while you tour the home.