2104 George St Rolling Meadows, IL 60008
Estimated Value: $343,000 - $403,701
4
Beds
2
Baths
1,704
Sq Ft
$226/Sq Ft
Est. Value
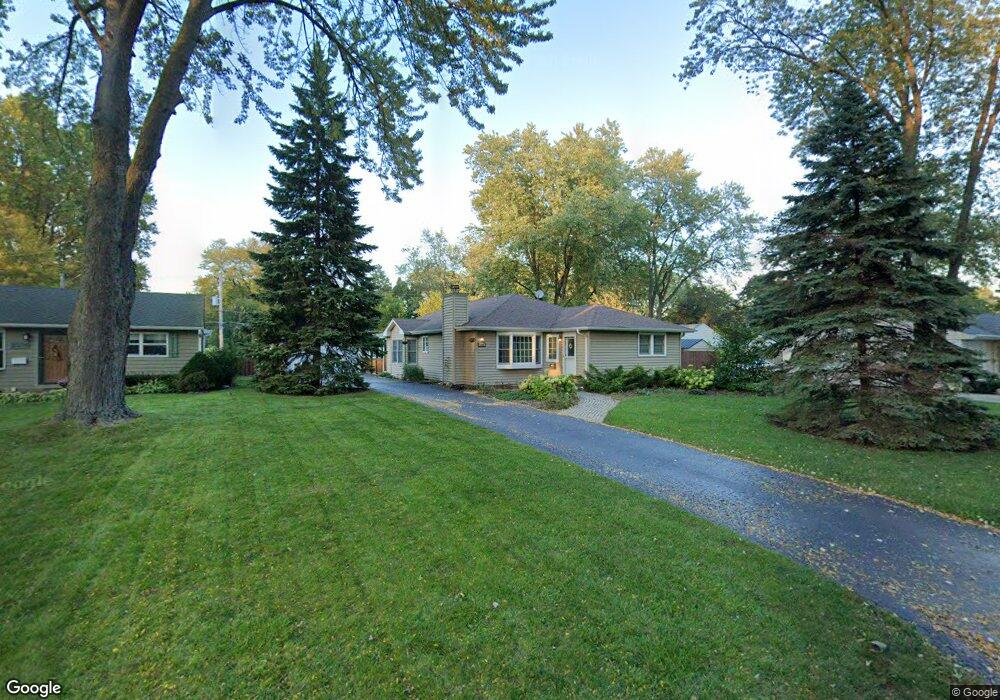
About This Home
This home is located at 2104 George St, Rolling Meadows, IL 60008 and is currently estimated at $384,925, approximately $225 per square foot. 2104 George St is a home located in Cook County with nearby schools including Kimball Hill Elementary School, Carl Sandburg Junior High School, and Rolling Meadows High School.
Ownership History
Date
Name
Owned For
Owner Type
Purchase Details
Closed on
May 16, 2018
Sold by
Bolash Jim J and Bolash Elizabeth M
Bought by
Bolash James J and Bolash Elizabeth M
Current Estimated Value
Purchase Details
Closed on
Jan 25, 2006
Sold by
Bolash Jim J
Bought by
Bolash Jim and Bolash Elizabeth
Home Financials for this Owner
Home Financials are based on the most recent Mortgage that was taken out on this home.
Original Mortgage
$81,000
Outstanding Balance
$44,550
Interest Rate
6.2%
Mortgage Type
Credit Line Revolving
Estimated Equity
$340,375
Purchase Details
Closed on
Nov 15, 2002
Sold by
Huber Richard A and Huber Margarete H
Bought by
Bolash Jim J and Bolash Elizabeth M
Home Financials for this Owner
Home Financials are based on the most recent Mortgage that was taken out on this home.
Original Mortgage
$154,800
Outstanding Balance
$64,707
Interest Rate
6.38%
Estimated Equity
$320,218
Purchase Details
Closed on
Jul 15, 1998
Sold by
Page Charlotte I
Bought by
Huber Richard A and Huber Margarete H
Home Financials for this Owner
Home Financials are based on the most recent Mortgage that was taken out on this home.
Original Mortgage
$115,200
Interest Rate
7.03%
Purchase Details
Closed on
May 20, 1997
Sold by
Page Charles R
Bought by
Page Charlotte I
Create a Home Valuation Report for This Property
The Home Valuation Report is an in-depth analysis detailing your home's value as well as a comparison with similar homes in the area
Home Values in the Area
Average Home Value in this Area
Purchase History
| Date | Buyer | Sale Price | Title Company |
|---|---|---|---|
| Bolash James J | -- | Attorney | |
| Bolash Jim | -- | Cti | |
| Bolash Jim J | $195,000 | Prairie Title | |
| Huber Richard A | $128,000 | -- | |
| Page Charlotte I | -- | -- |
Source: Public Records
Mortgage History
| Date | Status | Borrower | Loan Amount |
|---|---|---|---|
| Open | Bolash Jim | $81,000 | |
| Open | Bolash Jim J | $154,800 | |
| Previous Owner | Huber Richard A | $115,200 |
Source: Public Records
Tax History
| Year | Tax Paid | Tax Assessment Tax Assessment Total Assessment is a certain percentage of the fair market value that is determined by local assessors to be the total taxable value of land and additions on the property. | Land | Improvement |
|---|---|---|---|---|
| 2025 | $8,178 | $37,000 | $7,909 | $29,091 |
| 2024 | $8,178 | $30,000 | $6,692 | $23,308 |
| 2023 | $7,801 | $30,000 | $6,692 | $23,308 |
| 2022 | $7,801 | $30,000 | $6,692 | $23,308 |
| 2021 | $6,489 | $22,926 | $3,954 | $18,972 |
| 2020 | $6,410 | $22,926 | $3,954 | $18,972 |
| 2019 | $6,455 | $25,616 | $3,954 | $21,662 |
| 2018 | $7,543 | $26,723 | $3,650 | $23,073 |
| 2017 | $7,408 | $26,723 | $3,650 | $23,073 |
| 2016 | $7,161 | $26,723 | $3,650 | $23,073 |
| 2015 | $6,102 | $22,005 | $3,346 | $18,659 |
| 2014 | $5,973 | $22,005 | $3,346 | $18,659 |
| 2013 | $6,614 | $24,680 | $3,346 | $21,334 |
Source: Public Records
Map
Nearby Homes
- 2201 Kingfisher Ln
- 1215 W Sigwalt St Unit A
- 2705 Park St
- 2709 Lily Ln
- 3209 Trillium Cir
- 3306 Trillium Cir Unit 3001
- 3605 Oriole Ln
- 3100 Town Square Dr Unit 308
- 3100 Town Square Dr Unit 204
- 27 S Kaspar Ave
- 408 N Kennicott Ave
- 3135 Town Square Dr Unit 401
- 3712 Jay Ln
- 3710 Meadow Dr
- 3265 Kirchoff Rd Unit 116
- 516-20 W Wing St
- 3200 Thrush Ln
- 1506 W Northwest Hwy
- 3345 Kirchoff Rd Unit 5C
- 751 S Dwyer Ave Unit F
- 2102 George St
- 2106 George St
- 2200 George St
- 2103 Sigwalt St
- 2105 Sigwalt St
- 2705 Dove St Unit 1
- 2100 George St Unit 1
- 2703 Dove St
- 2107 Sigwalt St
- 2202 George St
- 2107 George St
- 2201 George St
- 2101 Sigwalt St
- 2201 Sigwalt St
- 2103 George St
- 2204 George St
- 2203 George St
- 2101 George St
- 2203 Sigwalt St
- 2205 George St
Your Personal Tour Guide
Ask me questions while you tour the home.