Estimated Value: $132,000 - $172,000
3
Beds
2
Baths
1,592
Sq Ft
$97/Sq Ft
Est. Value
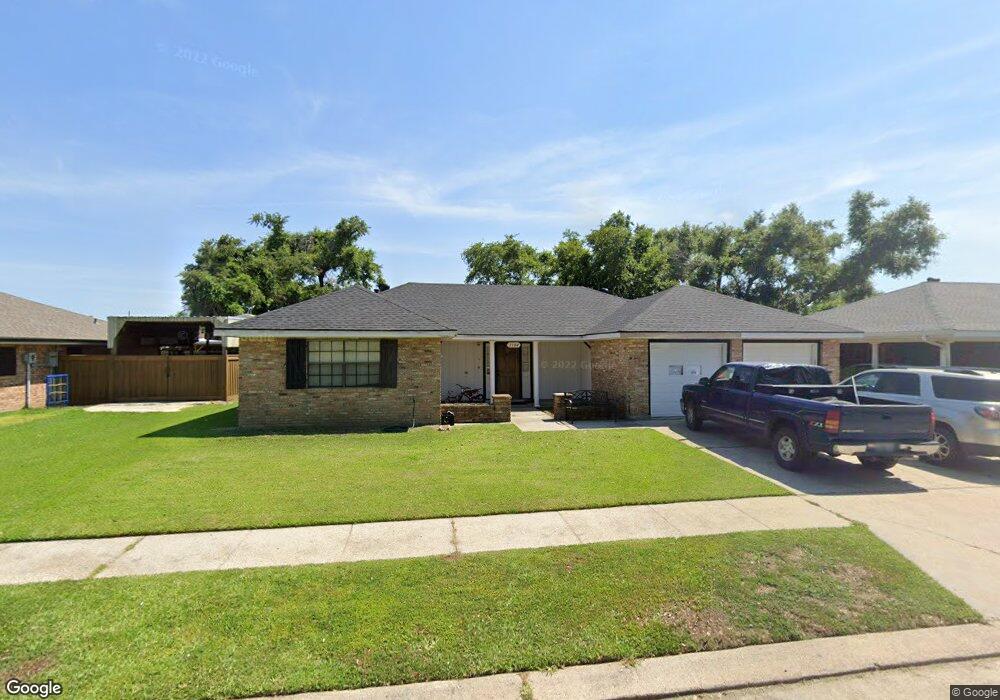
About This Home
This home is located at 2104 Ruby Dr, Houma, LA 70363 and is currently estimated at $154,378, approximately $96 per square foot. 2104 Ruby Dr is a home located in Terrebonne Parish with nearby schools including Acadian Elementary School, Oaklawn Middle School, and Ellender Memorial High School.
Ownership History
Date
Name
Owned For
Owner Type
Purchase Details
Closed on
Dec 1, 2017
Sold by
Secretary Housing Urban Development Of W
Bought by
Parfait Trent
Current Estimated Value
Home Financials for this Owner
Home Financials are based on the most recent Mortgage that was taken out on this home.
Original Mortgage
$101,232
Outstanding Balance
$85,228
Interest Rate
3.94%
Mortgage Type
New Conventional
Estimated Equity
$69,150
Purchase Details
Closed on
Dec 9, 2016
Sold by
Gateway Mortgage Group Llc
Bought by
Secretary Housing Urban Development Of W
Purchase Details
Closed on
Sep 14, 2016
Sold by
Gaiennie Matthew Charles and Gaiennie Madeline
Bought by
Gateway Mortgage Group Llc
Purchase Details
Closed on
Jun 17, 2014
Sold by
Hebert Henry J and Cordes Connie Hebert
Bought by
Gaiennie Matthew Charles and Gaiennie Madeline Lowe
Home Financials for this Owner
Home Financials are based on the most recent Mortgage that was taken out on this home.
Original Mortgage
$119,454
Interest Rate
4.12%
Mortgage Type
FHA
Create a Home Valuation Report for This Property
The Home Valuation Report is an in-depth analysis detailing your home's value as well as a comparison with similar homes in the area
Purchase History
| Date | Buyer | Sale Price | Title Company |
|---|---|---|---|
| Parfait Trent | -- | None Available | |
| Secretary Housing Urban Development Of W | $116,684 | None Available | |
| Gateway Mortgage Group Llc | $129,720 | None Available | |
| Gaiennie Matthew Charles | $142,000 | Attorney |
Source: Public Records
Mortgage History
| Date | Status | Borrower | Loan Amount |
|---|---|---|---|
| Open | Parfait Trent | $101,232 | |
| Previous Owner | Gaiennie Matthew Charles | $119,454 |
Source: Public Records
Tax History
| Year | Tax Paid | Tax Assessment Tax Assessment Total Assessment is a certain percentage of the fair market value that is determined by local assessors to be the total taxable value of land and additions on the property. | Land | Improvement |
|---|---|---|---|---|
| 2024 | $782 | $14,720 | $2,630 | $12,090 |
| 2023 | $797 | $13,430 | $2,470 | $10,960 |
| 2022 | $661 | $13,430 | $2,470 | $10,960 |
| 2021 | $550 | $12,330 | $2,470 | $9,860 |
| 2020 | $1,141 | $13,430 | $2,470 | $10,960 |
| 2019 | $1,178 | $12,790 | $2,350 | $10,440 |
| 2018 | $563 | $12,180 | $2,240 | $9,940 |
| 2017 | $1,139 | $12,180 | $2,240 | $9,940 |
| 2015 | $309 | $11,595 | $2,130 | $9,465 |
| 2014 | $509 | $11,595 | $0 | $0 |
| 2013 | $168 | $7,960 | $0 | $0 |
Source: Public Records
Map
Nearby Homes
- 2103 Ruby Dr
- 2007 Ruby Dr
- 2007 Ray Dr
- 600 Oaklawn Dr
- 2204 Acadian Dr
- 2216 Acadian Dr
- 406 Dauphine Ave
- 700 Mary Hughes Dr
- 217 Cretini Ln
- 522 Paris Ln
- 418 Hibernia Place
- 1366 Grand Caillou Rd
- 1118 Grand Caillou Rd
- 112 Evelyn Ave
- 305 Wildwood Dr
- 123 Jean Ellen Ave
- 303 Hialeah Ave
- 5090 Grand Caillou Rd
- 307 Hialeah Ave
- 1520 Grand Caillou Rd
Your Personal Tour Guide
Ask me questions while you tour the home.