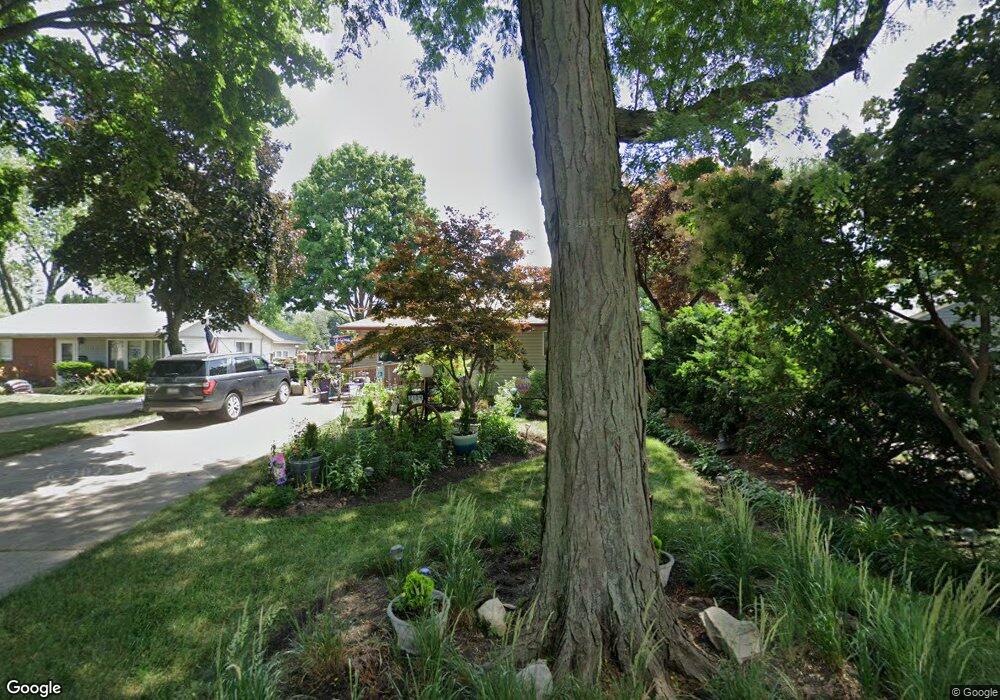
2104 Swan Ln Rolling Meadows, IL 60008
Estimated Value: $317,000 - $427,000
3
Beds
2
Baths
1,774
Sq Ft
$220/Sq Ft
Est. Value
About This Home
This home is located at 2104 Swan Ln, Rolling Meadows, IL 60008 and is currently estimated at $389,711, approximately $219 per square foot. 2104 Swan Ln is a home located in Cook County with nearby schools including Kimball Hill Elementary School, Carl Sandburg Junior High School, and Rolling Meadows High School.
Ownership History
Date
Name
Owned For
Owner Type
Purchase Details
Closed on
Jun 30, 1998
Sold by
Norys Jerome
Bought by
Chuboff David and Chuboff Sharon
Current Estimated Value
Home Financials for this Owner
Home Financials are based on the most recent Mortgage that was taken out on this home.
Original Mortgage
$102,000
Outstanding Balance
$26,007
Interest Rate
11.37%
Estimated Equity
$363,704
Purchase Details
Closed on
Jul 15, 1997
Sold by
Norys Jerome P and Norys Jennifer M
Bought by
Norys Jerome and Norys Jennifer M
Purchase Details
Closed on
Feb 23, 1996
Sold by
Poduch Gary S and Poduch Elizabeth M
Bought by
Norys Jerome P and Norys Jennifer M
Home Financials for this Owner
Home Financials are based on the most recent Mortgage that was taken out on this home.
Original Mortgage
$94,500
Interest Rate
7.16%
Create a Home Valuation Report for This Property
The Home Valuation Report is an in-depth analysis detailing your home's value as well as a comparison with similar homes in the area
Home Values in the Area
Average Home Value in this Area
Purchase History
| Date | Buyer | Sale Price | Title Company |
|---|---|---|---|
| Chuboff David | $127,500 | -- | |
| Norys Jerome | -- | -- | |
| Norys Jerome P | $126,000 | -- |
Source: Public Records
Mortgage History
| Date | Status | Borrower | Loan Amount |
|---|---|---|---|
| Open | Chuboff David | $102,000 | |
| Previous Owner | Norys Jerome P | $94,500 |
Source: Public Records
Tax History
| Year | Tax Paid | Tax Assessment Tax Assessment Total Assessment is a certain percentage of the fair market value that is determined by local assessors to be the total taxable value of land and additions on the property. | Land | Improvement |
|---|---|---|---|---|
| 2025 | $7,872 | $34,000 | $6,630 | $27,370 |
| 2024 | $7,872 | $29,000 | $5,610 | $23,390 |
| 2023 | $7,508 | $29,000 | $5,610 | $23,390 |
| 2022 | $7,508 | $29,000 | $5,610 | $23,390 |
| 2021 | $5,548 | $20,082 | $3,315 | $16,767 |
| 2020 | $5,491 | $20,082 | $3,315 | $16,767 |
| 2019 | $5,530 | $22,439 | $3,315 | $19,124 |
| 2018 | $7,488 | $26,555 | $3,060 | $23,495 |
| 2017 | $7,355 | $26,555 | $3,060 | $23,495 |
| 2016 | $7,111 | $26,555 | $3,060 | $23,495 |
| 2015 | $5,743 | $20,864 | $2,805 | $18,059 |
| 2014 | $5,623 | $20,864 | $2,805 | $18,059 |
| 2013 | $6,262 | $23,504 | $2,805 | $20,699 |
Source: Public Records
Map
Nearby Homes
- 2302 Flicker Ln
- 2401 Rohlwing Rd
- 2705 Park St
- 3100 Town Square Dr Unit 308
- 3100 Town Square Dr Unit 204
- 3265 Kirchoff Rd Unit 116
- 3135 Town Square Dr Unit 401
- 3135 Town Square Dr Unit 104
- 3345 Kirchoff Rd Unit 5C
- 3306 Trillium Cir Unit 3001
- 3209 Trillium Cir
- 2709 Lily Ln
- 2600 Brookwood Way Dr Unit 316
- 2600 Brookwood Way Dr Unit 305
- 2650 Brookwood Way Dr Unit 313
- 2650 Brookwood Way Dr Unit 108
- 3200 Thrush Ln
- 912 N Chicago Ave
- 2201 Kingfisher Ln
- 304 E Tall Trees Ln
Your Personal Tour Guide
Ask me questions while you tour the home.