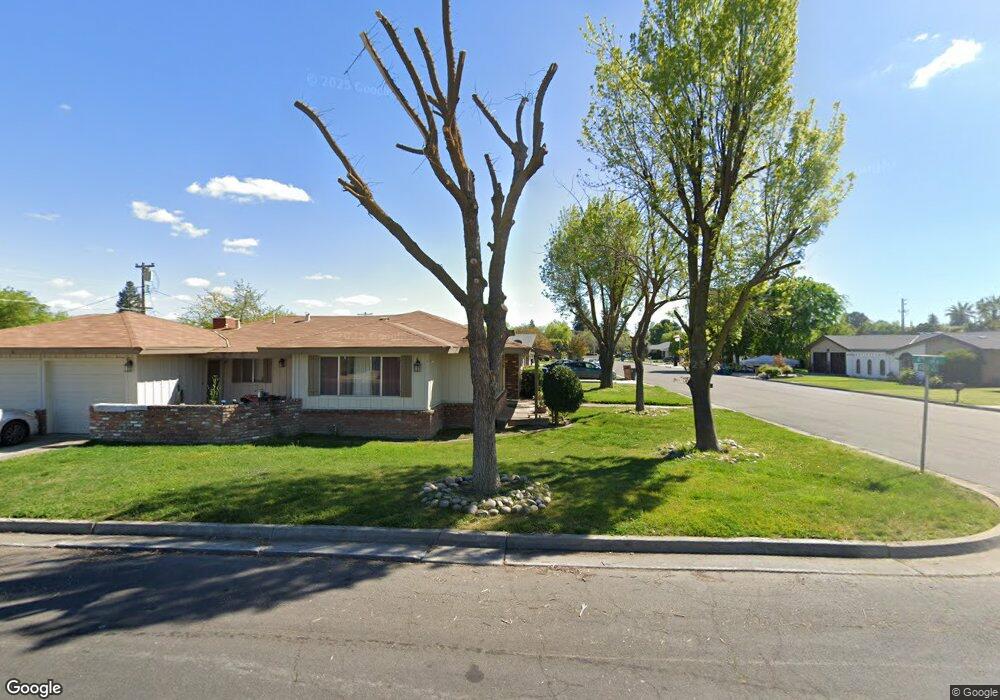
2104 W 4th St Madera, CA 93637
West Madera NeighborhoodEstimated Value: $370,219 - $387,000
3
Beds
2
Baths
1,737
Sq Ft
$217/Sq Ft
Est. Value
About This Home
This home is located at 2104 W 4th St, Madera, CA 93637 and is currently estimated at $377,555, approximately $217 per square foot. 2104 W 4th St is a home located in Madera County with nearby schools including John Adams Elementary School, Thomas Jefferson Middle School, and Madera High School.
Ownership History
Date
Name
Owned For
Owner Type
Purchase Details
Closed on
Jan 4, 2016
Sold by
Steinauer Claudia S
Bought by
Roberts Aaron D
Current Estimated Value
Home Financials for this Owner
Home Financials are based on the most recent Mortgage that was taken out on this home.
Original Mortgage
$186,558
Outstanding Balance
$147,345
Interest Rate
3.75%
Mortgage Type
FHA
Estimated Equity
$230,210
Purchase Details
Closed on
Mar 20, 2012
Sold by
Kludjian James
Bought by
Steinauer Claudia S
Purchase Details
Closed on
Jan 5, 2012
Sold by
Cowles Jeffrey R
Bought by
Kludjian James
Purchase Details
Closed on
May 24, 2005
Sold by
Michelson E Ronald and Michelson Jeri D
Bought by
Cowles Jeffrey R
Home Financials for this Owner
Home Financials are based on the most recent Mortgage that was taken out on this home.
Original Mortgage
$254,999
Interest Rate
5.72%
Mortgage Type
Fannie Mae Freddie Mac
Create a Home Valuation Report for This Property
The Home Valuation Report is an in-depth analysis detailing your home's value as well as a comparison with similar homes in the area
Home Values in the Area
Average Home Value in this Area
Purchase History
| Date | Buyer | Sale Price | Title Company |
|---|---|---|---|
| Roberts Aaron D | $190,000 | Chicago Title Company | |
| Steinauer Claudia S | $133,500 | Chicago Title Company | |
| Kludjian James | $62,500 | None Available | |
| Cowles Jeffrey R | $300,000 | First American Title |
Source: Public Records
Mortgage History
| Date | Status | Borrower | Loan Amount |
|---|---|---|---|
| Open | Roberts Aaron D | $186,558 | |
| Previous Owner | Cowles Jeffrey R | $254,999 |
Source: Public Records
Tax History
| Year | Tax Paid | Tax Assessment Tax Assessment Total Assessment is a certain percentage of the fair market value that is determined by local assessors to be the total taxable value of land and additions on the property. | Land | Improvement |
|---|---|---|---|---|
| 2025 | $2,624 | $224,915 | $71,024 | $153,891 |
| 2023 | $2,624 | $216,183 | $68,267 | $147,916 |
| 2022 | $2,453 | $211,945 | $66,929 | $145,016 |
| 2021 | $2,407 | $207,790 | $65,617 | $142,173 |
| 2020 | $2,451 | $205,661 | $64,945 | $140,716 |
| 2019 | $2,433 | $201,629 | $63,672 | $137,957 |
| 2018 | $2,245 | $197,676 | $62,424 | $135,252 |
| 2017 | $2,219 | $193,800 | $61,200 | $132,600 |
| 2016 | $1,618 | $141,328 | $53,050 | $88,278 |
| 2015 | $1,581 | $139,206 | $52,254 | $86,952 |
| 2014 | $1,477 | $136,480 | $51,231 | $85,249 |
Source: Public Records
Map
Nearby Homes
- 101 Mainberry Dr
- 2428 W 3rd St
- 402 Mainberry Dr
- 11 Seasons Ct
- 125 S Granada Dr Unit 42
- 1803 Sunset Ave
- 430 Rotan Ave
- 242 Makenna Dr
- 716 Willis Ave
- 15707 Road 22 1 2
- 3124 Summer Ln
- 901 Valley Way
- 3188 Winter Way
- 294 Double Tree Ct
- 418 S Creek Dr
- 2512 Driftwood Dr
- 1632 University Ave
- 2411 Driftwood Dr
- 99 Rosewood Cir
- 3108 Capistrano Dr
Your Personal Tour Guide
Ask me questions while you tour the home.