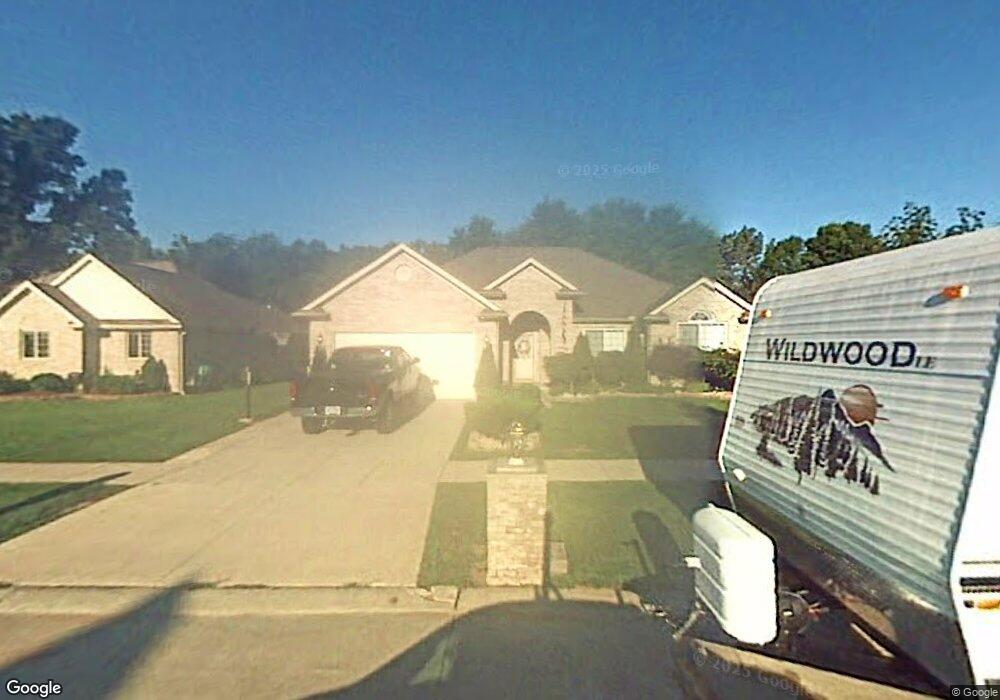
21044 Fellrath Ave Unit FELLRATH AVE Romulus, MI 48174
Estimated Value: $353,092 - $449,000
3
Beds
2
Baths
1,780
Sq Ft
$224/Sq Ft
Est. Value
About This Home
This home is located at 21044 Fellrath Ave Unit FELLRATH AVE, Romulus, MI 48174 and is currently estimated at $399,023, approximately $224 per square foot. 21044 Fellrath Ave Unit FELLRATH AVE is a home located in Wayne County with nearby schools including Wegienka Elementary School, Brownstown Middle School, and Patrick Henry Middle School.
Ownership History
Date
Name
Owned For
Owner Type
Purchase Details
Closed on
Mar 12, 2021
Sold by
Richmond Russell P and Richmond Kendra S
Bought by
Mosley Brent N
Current Estimated Value
Home Financials for this Owner
Home Financials are based on the most recent Mortgage that was taken out on this home.
Original Mortgage
$265,500
Outstanding Balance
$238,123
Interest Rate
2.73%
Mortgage Type
New Conventional
Estimated Equity
$160,900
Purchase Details
Closed on
Aug 1, 2014
Sold by
Blue Mountain Homes Llc
Bought by
Richmond Russell P
Purchase Details
Closed on
Dec 18, 2013
Sold by
The Bank Of New York Mellon
Bought by
Blue Mountain Homes Llc
Purchase Details
Closed on
Feb 14, 2013
Sold by
Still Sandra M and Still James A
Bought by
The Bank Of New York Mellon and The Bank Of New York
Purchase Details
Closed on
Mar 19, 2012
Sold by
Still James A and Still Sandra M
Bought by
Still James A
Create a Home Valuation Report for This Property
The Home Valuation Report is an in-depth analysis detailing your home's value as well as a comparison with similar homes in the area
Home Values in the Area
Average Home Value in this Area
Purchase History
| Date | Buyer | Sale Price | Title Company |
|---|---|---|---|
| Mosley Brent N | $302,500 | First American Title | |
| Mosley Brent N | $302,500 | First American Title | |
| Richmond Russell P | $210,000 | None Available | |
| Blue Mountain Homes Llc | $149,625 | Servicelink | |
| The Bank Of New York Mellon | $240,769 | None Available | |
| Still James A | -- | None Available |
Source: Public Records
Mortgage History
| Date | Status | Borrower | Loan Amount |
|---|---|---|---|
| Open | Mosley Brent N | $265,500 | |
| Closed | Mosley Brent N | $265,500 |
Source: Public Records
Tax History Compared to Growth
Tax History
| Year | Tax Paid | Tax Assessment Tax Assessment Total Assessment is a certain percentage of the fair market value that is determined by local assessors to be the total taxable value of land and additions on the property. | Land | Improvement |
|---|---|---|---|---|
| 2025 | $3,591 | $159,800 | $0 | $0 |
| 2024 | $3,591 | $151,900 | $0 | $0 |
| 2023 | $3,425 | $146,700 | $0 | $0 |
| 2022 | $6,176 | $129,100 | $0 | $0 |
| 2021 | $5,431 | $112,400 | $0 | $0 |
| 2020 | $5,324 | $104,200 | $0 | $0 |
| 2019 | $4,841 | $103,100 | $0 | $0 |
| 2018 | $2,483 | $98,000 | $0 | $0 |
| 2017 | $4,265 | $129,800 | $0 | $0 |
| 2016 | $4,490 | $98,900 | $0 | $0 |
| 2015 | $9,500 | $95,000 | $0 | $0 |
| 2013 | $7,690 | $79,400 | $0 | $0 |
| 2012 | -- | $76,400 | $15,100 | $61,300 |
Source: Public Records
Map
Nearby Homes
- 25609 King Rd
- 22701 Beech Daly Rd
- 20730 Doves Pointe Dr Unit 14
- 20701 Doves Pointe Dr Unit 85
- 22171 Knollwood Dr
- 22213 Inkster Rd
- 00 West Rd
- 19340 Heiden Dr Unit 20
- 27557 Bredow Ave
- 25679 Sibley Rd
- 22017 Letour St
- 22886 Sylvan Ave
- 19497 Inkster Rd
- 19497 Inkster Rd
- VAC Sibley Rd
- 19106 Sylvia Ave
- 27520 West Rd
- 23855 Lillian St
- 19234 Buck Ave
- 00 Liddle St
- 21044 Fellrath Ave
- 21056 Fellrath Ave
- 21032 Fellrath Ave
- 21068 Fellrath Ave
- 26137 King Rd
- 26069 King Rd
- 26115 King Rd
- 21043 Fellrath Ave
- 21055 Fellrath Ave
- 21031 Fellrath Ave
- 21080 Fellrath Ave
- 26053 King Rd
- 26201 King Rd
- 21093 Harold Ave
- 21081 Harold Ave
- 21069 Harold Ave
- 21045 Harold Ave
- 21092 Fellrath Ave
- 21033 Harold Ave
- 21079 Fellrath Ave