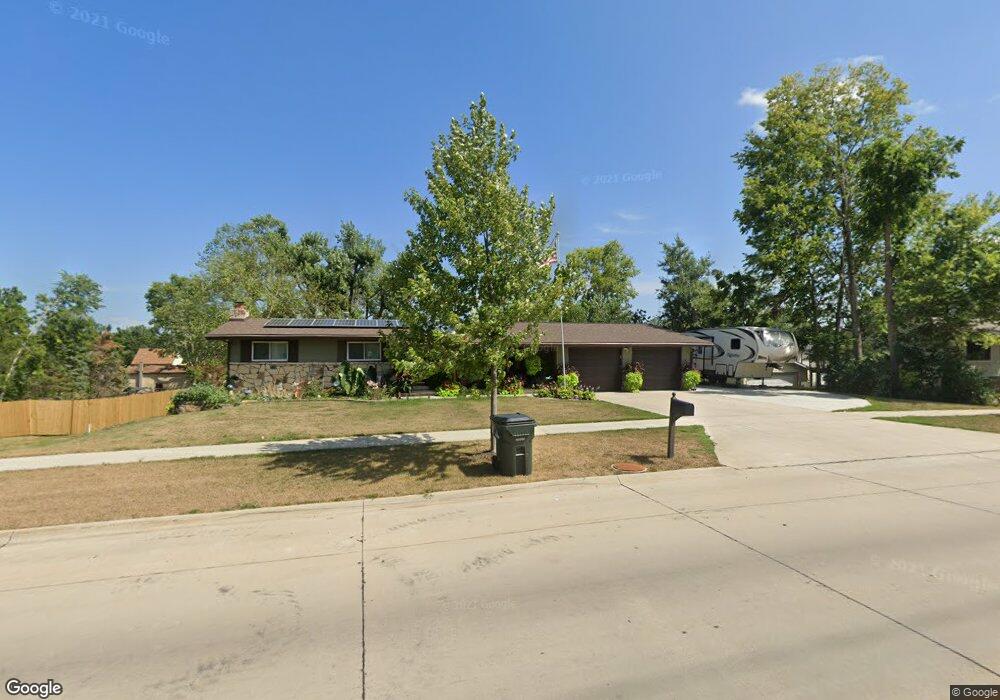
2105 18th St SW Cedar Rapids, IA 52404
Estimated Value: $250,000 - $305,000
4
Beds
3
Baths
1,216
Sq Ft
$228/Sq Ft
Est. Value
About This Home
This home is located at 2105 18th St SW, Cedar Rapids, IA 52404 and is currently estimated at $277,472, approximately $228 per square foot. 2105 18th St SW is a home located in Linn County with nearby schools including Junction City Elementary School, Perryville Elementary School, and Van Buren Elementary School.
Ownership History
Date
Name
Owned For
Owner Type
Purchase Details
Closed on
Oct 16, 2020
Sold by
Spina Arlene
Bought by
Wickham Brian and Wickham Charisma
Current Estimated Value
Purchase Details
Closed on
Jun 15, 2007
Sold by
Smith Debra J and Smith Troy D
Bought by
Mclees Charisma Joy and Wickham Brian Irvin
Home Financials for this Owner
Home Financials are based on the most recent Mortgage that was taken out on this home.
Original Mortgage
$120,000
Interest Rate
6.2%
Mortgage Type
Unknown
Create a Home Valuation Report for This Property
The Home Valuation Report is an in-depth analysis detailing your home's value as well as a comparison with similar homes in the area
Home Values in the Area
Average Home Value in this Area
Purchase History
| Date | Buyer | Sale Price | Title Company |
|---|---|---|---|
| Wickham Brian | $22,000 | None Listed On Document | |
| Mclees Charisma Joy | $149,500 | None Available |
Source: Public Records
Mortgage History
| Date | Status | Borrower | Loan Amount |
|---|---|---|---|
| Previous Owner | Mclees Charisma Joy | $120,000 |
Source: Public Records
Tax History Compared to Growth
Tax History
| Year | Tax Paid | Tax Assessment Tax Assessment Total Assessment is a certain percentage of the fair market value that is determined by local assessors to be the total taxable value of land and additions on the property. | Land | Improvement |
|---|---|---|---|---|
| 2025 | $3,362 | $260,900 | $76,300 | $184,600 |
| 2024 | $3,362 | -- | -- | -- |
| 2023 | $3,362 | $215,400 | $42,000 | $173,400 |
| 2022 | $3,140 | $168,300 | $35,700 | $132,600 |
| 2021 | $3,212 | $160,500 | $35,700 | $124,800 |
| 2020 | $3,212 | $154,200 | $33,600 | $120,600 |
| 2019 | $6,150 | $150,500 | $33,600 | $116,900 |
| 2018 | $2,790 | $141,800 | $33,600 | $108,200 |
| 2017 | $2,838 | $138,800 | $33,600 | $105,200 |
| 2016 | $2,925 | $137,600 | $35,700 | $101,900 |
| 2015 | $3,293 | $154,773 | $35,670 | $119,103 |
| 2014 | $3,108 | $159,788 | $35,670 | $124,118 |
| 2013 | $3,142 | $159,788 | $35,670 | $124,118 |
Source: Public Records
Map
Nearby Homes
- 2025 18th St SW
- 2150 Rockford Rd SW
- 2105 Milligan Ct SW
- 1960 Rockford Rd SW Unit 45
- 1801 Shady Grove Rd SW
- 1806 Holly Meadow Ave SW
- 1812 Holly Meadow Ave SW
- 1824 Holly Meadow Ave SW
- 1913 Holly Meadow Ave SW
- 1818 Holly Meadow Ave SW
- 2126 Snapdragon Cir SW
- 1332 Wilson Ave SW
- 1318 22nd Ave SW
- 1312 Wilson Ave SW
- 2207 Shady Grove Rd SW
- Remington - Cedar Rapids Plan at Whispering Pines
- Copeland Plan at Whispering Pines
- Meadowbrook - Cedar Rapids Plan at Stags Leap Estates
- Caldwell Plan at Stags Leap Estates
- Concord - Cedar Rapids Plan at Stags Leap Estates
- 2121 18th St SW
- 2124 Rockford Rd SW Unit 8
- 2124 Rockford Rd SW Unit 7
- 2124 Rockford Rd SW Unit 6
- 2124 Rockford Rd SW Unit 5
- 2124 Rockford Rd SW Unit 4
- 2124 Rockford Rd SW Unit 3
- 2124 Rockford Rd SW Unit 2
- 2124 Rockford Rd SW Unit 1
- 2125 18th St SW
- 2129 18th St SW
- 2102 18th St SW
- 2100 18th St SW
- 2120 18th St SW
- 2026 18th St SW
- 2120 Rockford Rd SW Unit 6
- 2120 Rockford Rd SW Unit 5
- 2120 Rockford Rd SW Unit 4
- 2120 Rockford Rd SW Unit 3
- 2120 Rockford Rd SW Unit 2