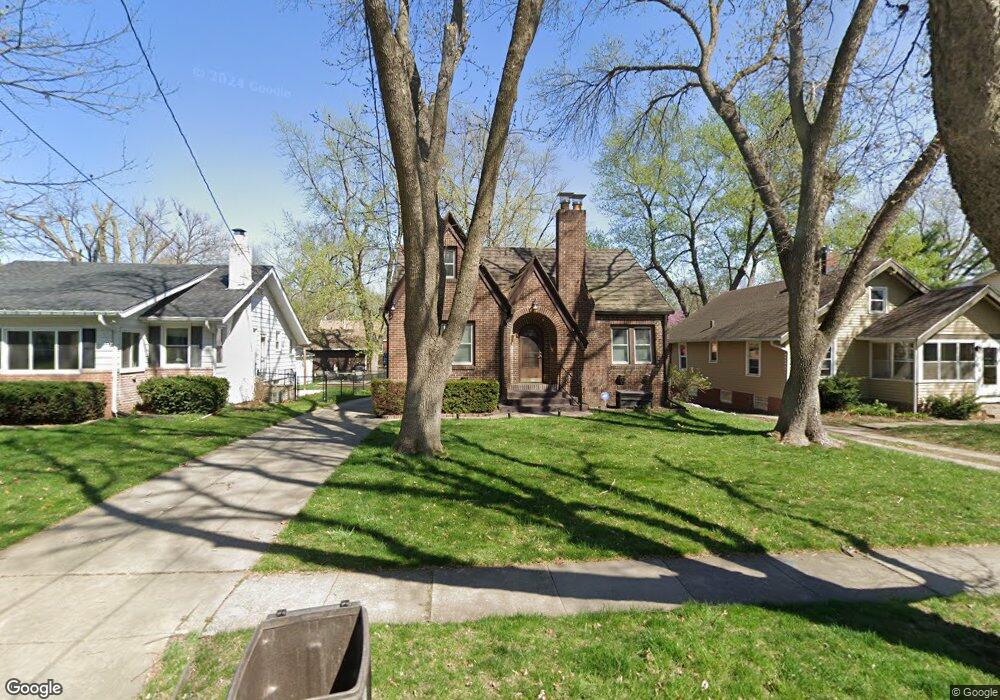
2105 40th Place Des Moines, IA 50310
Beaverdale NeighborhoodEstimated Value: $290,000 - $319,000
3
Beds
3
Baths
1,432
Sq Ft
$214/Sq Ft
Est. Value
About This Home
This home is located at 2105 40th Place, Des Moines, IA 50310 and is currently estimated at $307,157, approximately $214 per square foot. 2105 40th Place is a home located in Polk County with nearby schools including Perkins Elementary School, Merrill Middle School, and Roosevelt High School.
Ownership History
Date
Name
Owned For
Owner Type
Purchase Details
Closed on
Sep 11, 2023
Sold by
Conrad Roberta A and Conrad Marlyn E
Bought by
Marian Andressa
Current Estimated Value
Purchase Details
Closed on
Jun 27, 2000
Sold by
Barr Mia Renee and Barr Christopher D
Bought by
Conrad Roberta A and Freese Marlyn E
Home Financials for this Owner
Home Financials are based on the most recent Mortgage that was taken out on this home.
Original Mortgage
$95,200
Interest Rate
8.66%
Purchase Details
Closed on
Sep 30, 1997
Sold by
Speck Robert J and Speck Christina M
Bought by
Barr Christopher D and Barr Mia R
Home Financials for this Owner
Home Financials are based on the most recent Mortgage that was taken out on this home.
Original Mortgage
$94,050
Interest Rate
7.54%
Mortgage Type
Balloon
Create a Home Valuation Report for This Property
The Home Valuation Report is an in-depth analysis detailing your home's value as well as a comparison with similar homes in the area
Home Values in the Area
Average Home Value in this Area
Purchase History
| Date | Buyer | Sale Price | Title Company |
|---|---|---|---|
| Marian Andressa | $310,000 | None Listed On Document | |
| Marian Andressa | $310,000 | None Listed On Document | |
| Conrad Roberta A | $118,500 | -- | |
| Barr Christopher D | $104,000 | -- |
Source: Public Records
Mortgage History
| Date | Status | Borrower | Loan Amount |
|---|---|---|---|
| Previous Owner | Conrad Roberta A | $95,200 | |
| Previous Owner | Barr Christopher D | $94,050 |
Source: Public Records
Tax History Compared to Growth
Tax History
| Year | Tax Paid | Tax Assessment Tax Assessment Total Assessment is a certain percentage of the fair market value that is determined by local assessors to be the total taxable value of land and additions on the property. | Land | Improvement |
|---|---|---|---|---|
| 2025 | $4,724 | $291,900 | $45,600 | $246,300 |
| 2024 | $4,724 | $266,400 | $41,000 | $225,400 |
| 2023 | $4,882 | $266,400 | $41,000 | $225,400 |
| 2022 | $4,844 | $224,800 | $36,200 | $188,600 |
| 2021 | $4,726 | $224,800 | $36,200 | $188,600 |
| 2020 | $4,904 | $206,700 | $33,100 | $173,600 |
| 2019 | $4,594 | $206,700 | $33,100 | $173,600 |
| 2018 | $4,542 | $188,200 | $29,500 | $158,700 |
| 2017 | $4,060 | $188,200 | $29,500 | $158,700 |
| 2016 | $3,952 | $167,400 | $25,800 | $141,600 |
| 2015 | $3,952 | $167,400 | $25,800 | $141,600 |
| 2014 | $3,686 | $156,200 | $23,600 | $132,600 |
Source: Public Records
Map
Nearby Homes