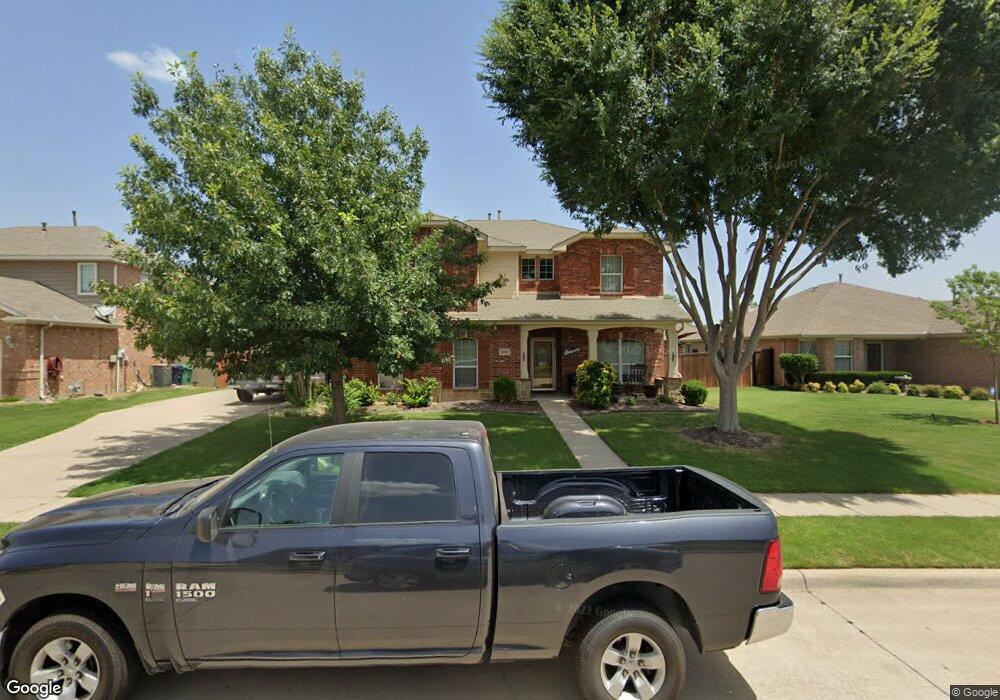
2105 Belmont Park Dr Denton, TX 76210
South Denton NeighborhoodEstimated Value: $422,281 - $490,000
4
Beds
3
Baths
2,818
Sq Ft
$163/Sq Ft
Est. Value
About This Home
This home is located at 2105 Belmont Park Dr, Denton, TX 76210 and is currently estimated at $459,570, approximately $163 per square foot. 2105 Belmont Park Dr is a home located in Denton County with nearby schools including Ryan Elementary School, Crownover Middle School, and Guyer High School.
Ownership History
Date
Name
Owned For
Owner Type
Purchase Details
Closed on
Aug 24, 2012
Sold by
Barb Arlene A
Bought by
Gustafson Edward and Gustafson Alicia
Current Estimated Value
Home Financials for this Owner
Home Financials are based on the most recent Mortgage that was taken out on this home.
Original Mortgage
$183,150
Outstanding Balance
$126,579
Interest Rate
3.62%
Mortgage Type
FHA
Estimated Equity
$332,991
Purchase Details
Closed on
Mar 1, 2012
Sold by
Barb Joseph Alvin
Bought by
Barb Arlene Ann
Purchase Details
Closed on
Jun 29, 2006
Sold by
Ashton Dallas Residential Llc
Bought by
Barb Arlene A
Home Financials for this Owner
Home Financials are based on the most recent Mortgage that was taken out on this home.
Original Mortgage
$44,500
Interest Rate
6.67%
Mortgage Type
Stand Alone Second
Create a Home Valuation Report for This Property
The Home Valuation Report is an in-depth analysis detailing your home's value as well as a comparison with similar homes in the area
Home Values in the Area
Average Home Value in this Area
Purchase History
| Date | Buyer | Sale Price | Title Company |
|---|---|---|---|
| Gustafson Edward | -- | Old Republic Title | |
| Barb Arlene Ann | -- | None Available | |
| Barb Arlene A | -- | Stewart Title |
Source: Public Records
Mortgage History
| Date | Status | Borrower | Loan Amount |
|---|---|---|---|
| Open | Gustafson Edward | $183,150 | |
| Previous Owner | Barb Arlene A | $44,500 | |
| Previous Owner | Barb Arlene A | $178,000 | |
| Closed | Barb Arlene Ann | $0 |
Source: Public Records
Tax History Compared to Growth
Tax History
| Year | Tax Paid | Tax Assessment Tax Assessment Total Assessment is a certain percentage of the fair market value that is determined by local assessors to be the total taxable value of land and additions on the property. | Land | Improvement |
|---|---|---|---|---|
| 2025 | $7,690 | $458,905 | $101,750 | $357,155 |
| 2024 | $8,885 | $460,334 | $0 | $0 |
| 2023 | $6,793 | $418,485 | $101,750 | $411,686 |
| 2022 | $8,076 | $380,441 | $83,250 | $320,091 |
| 2021 | $7,688 | $346,248 | $51,338 | $294,910 |
| 2020 | $7,187 | $314,414 | $51,338 | $263,076 |
| 2019 | $7,370 | $308,883 | $51,338 | $257,545 |
| 2018 | $7,186 | $297,481 | $51,338 | $246,143 |
| 2017 | $6,811 | $275,548 | $51,338 | $224,210 |
| 2016 | $6,207 | $251,121 | $51,338 | $208,382 |
| 2015 | $5,031 | $228,292 | $40,238 | $188,054 |
| 2014 | $5,031 | $211,699 | $40,238 | $171,461 |
| 2013 | -- | $192,574 | $40,238 | $152,336 |
Source: Public Records
Map
Nearby Homes
- 2112 Del Mar Ct
- 2316 Del Mar Ct
- 1917 Belmont Park Dr
- 2005 Creekdale Dr
- 1917 Prescott Downs Dr
- 4125 Colina Ave
- 2401 Creekdale Dr
- 2109 Hemingway Dr
- 1913 Pavilion Ln
- 4613 Bernstein Blvd
- 7100 Frost Ln
- 2412 Miranda Place
- 4100 Fanita Place
- 1517 Miranda Ln
- 5718 Green Ivy Rd
- 2825 Desert Dr
- 7301 Chaucer Dr
- 3933 Parkhaven Dr
- 6301 English Saddle Ln
- 2924 Desert Dr
- 2109 Belmont Park Dr
- 2101 Belmont Park Dr
- 2104 Del Mar Ct
- 2108 Del Mar Ct
- 2100 Del Mar Ct
- 2113 Belmont Park Dr
- 2021 Belmont Park Dr
- 2104 Belmont Park Dr
- 2108 Belmont Park Dr
- 2100 Belmont Park Dr
- 2020 Del Mar Ct
- 2017 Belmont Park Dr
- 2112 Belmont Park Dr
- 2020 Belmont Park Dr
- 2016 Del Mar Ct
- 2201 Belmont Park Dr
- 2016 Belmont Park Dr
- 2116 Belmont Park Dr
- 2013 Belmont Park Dr
- 2105 Del Mar Ct