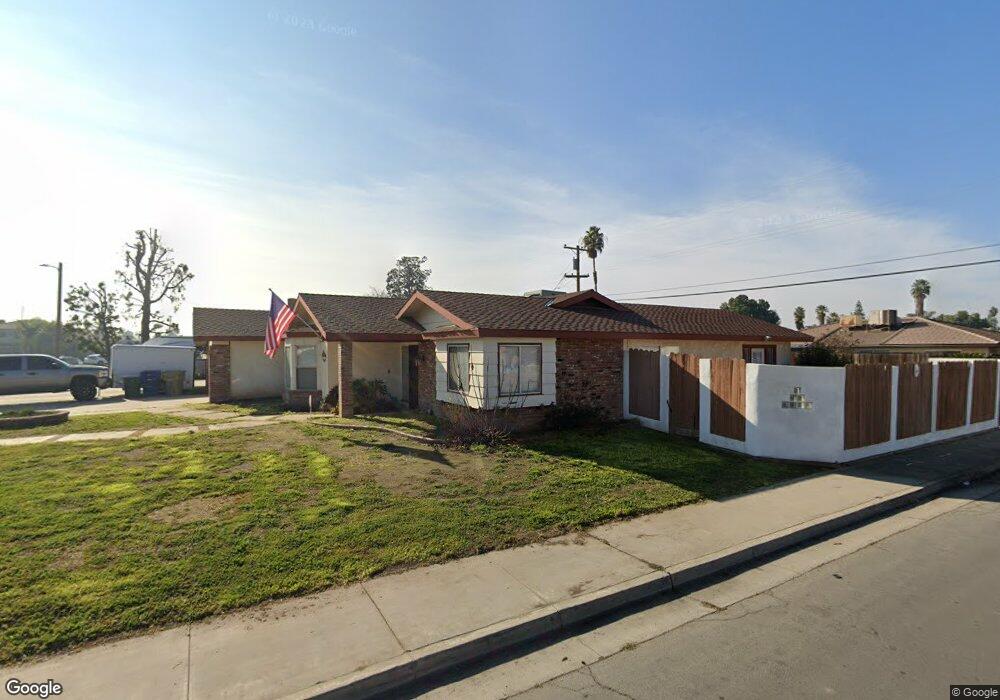
2105 Canter Way Bakersfield, CA 93309
Southwest Bakersfield NeighborhoodEstimated Value: $351,318 - $387,000
3
Beds
2
Baths
1,641
Sq Ft
$229/Sq Ft
Est. Value
About This Home
This home is located at 2105 Canter Way, Bakersfield, CA 93309 and is currently estimated at $375,580, approximately $228 per square foot. 2105 Canter Way is a home located in Kern County with nearby schools including Stine Elementary School, Fred L. Thompson Junior High School, and West High School.
Ownership History
Date
Name
Owned For
Owner Type
Purchase Details
Closed on
Aug 29, 2017
Sold by
Unruh Jeffrey and Unruh Julie K
Bought by
Unruh Julie K
Current Estimated Value
Home Financials for this Owner
Home Financials are based on the most recent Mortgage that was taken out on this home.
Original Mortgage
$166,400
Outstanding Balance
$114,807
Interest Rate
3.9%
Mortgage Type
New Conventional
Estimated Equity
$260,773
Purchase Details
Closed on
Mar 16, 2009
Sold by
Capilla Al and Capilla Belinda Connie
Bought by
Capilla Dylan Matthew
Home Financials for this Owner
Home Financials are based on the most recent Mortgage that was taken out on this home.
Original Mortgage
$166,871
Interest Rate
5.15%
Mortgage Type
FHA
Purchase Details
Closed on
Mar 6, 2009
Sold by
Capilla Dylan Matthew
Bought by
Unruh Jeffrey and Defoor Julie
Home Financials for this Owner
Home Financials are based on the most recent Mortgage that was taken out on this home.
Original Mortgage
$166,871
Interest Rate
5.15%
Mortgage Type
FHA
Purchase Details
Closed on
Jun 27, 2002
Sold by
Capilla Al and Capilla Belinda Connie
Bought by
Capilla Al and Capilla Belinda Connie
Create a Home Valuation Report for This Property
The Home Valuation Report is an in-depth analysis detailing your home's value as well as a comparison with similar homes in the area
Home Values in the Area
Average Home Value in this Area
Purchase History
| Date | Buyer | Sale Price | Title Company |
|---|---|---|---|
| Unruh Julie K | -- | Chicago Title Company | |
| Capilla Dylan Matthew | -- | Placer Title Company | |
| Unruh Jeffrey | $170,000 | Placer Title Company | |
| Capilla Al | -- | -- |
Source: Public Records
Mortgage History
| Date | Status | Borrower | Loan Amount |
|---|---|---|---|
| Open | Unruh Julie K | $166,400 | |
| Closed | Unruh Jeffrey | $166,871 |
Source: Public Records
Tax History Compared to Growth
Tax History
| Year | Tax Paid | Tax Assessment Tax Assessment Total Assessment is a certain percentage of the fair market value that is determined by local assessors to be the total taxable value of land and additions on the property. | Land | Improvement |
|---|---|---|---|---|
| 2025 | $3,217 | $218,902 | $32,183 | $186,719 |
| 2024 | $3,166 | $214,610 | $31,552 | $183,058 |
| 2023 | $3,166 | $210,403 | $30,934 | $179,469 |
| 2022 | $3,037 | $206,278 | $30,328 | $175,950 |
| 2021 | $2,920 | $202,234 | $29,734 | $172,500 |
| 2020 | $2,868 | $200,162 | $29,430 | $170,732 |
| 2019 | $2,829 | $200,162 | $29,430 | $170,732 |
| 2018 | $2,703 | $192,391 | $28,288 | $164,103 |
| 2017 | $2,662 | $188,620 | $27,734 | $160,886 |
| 2016 | $2,492 | $184,923 | $27,191 | $157,732 |
| 2015 | $2,469 | $182,146 | $26,783 | $155,363 |
| 2014 | $2,142 | $155,000 | $39,000 | $116,000 |
Source: Public Records
Map
Nearby Homes
- 5005 Surrey Ln
- 4701 Misty Ct
- 5116 Sherman Ave
- 5009 Stormy Ct
- 2213 Sandpiper Rd
- 2304 Bladen St
- 4408 Flicker Dr
- 1916 Hasti Acres Dr
- 1912 Hasti Acres Dr
- 2209 Westminster Dr
- 2600 Layton Dr
- 4830 Taurus Ct
- 2109 Oriole St
- 2415 Bladen St
- 4917 Scorpio Ct
- 1437 Libra Ct
- 4608 Posada Ave
- 1455 Gemini Ct
- 1413 Libra Ct
- 2504 Prestwick Ct
- 2113 Canter Way
- 2100 Emerson St
- 2104 Emerson St
- 2017 Canter Way
- 2117 Canter Way
- 4829 Surrey Ln
- 2108 Emerson St
- 2016 Emerson St
- 2013 Canter Way
- 2112 Canter Way
- 4828 Surrey Ln
- 4825 Surrey Ln
- 2121 Canter Way
- 2112 Emerson St
- 2012 Emerson St
- 4716 Flicker Dr
- 4824 Surrey Ln
- 2009 Canter Way
- 5001 Surrey Ln
- 2116 Emerson St