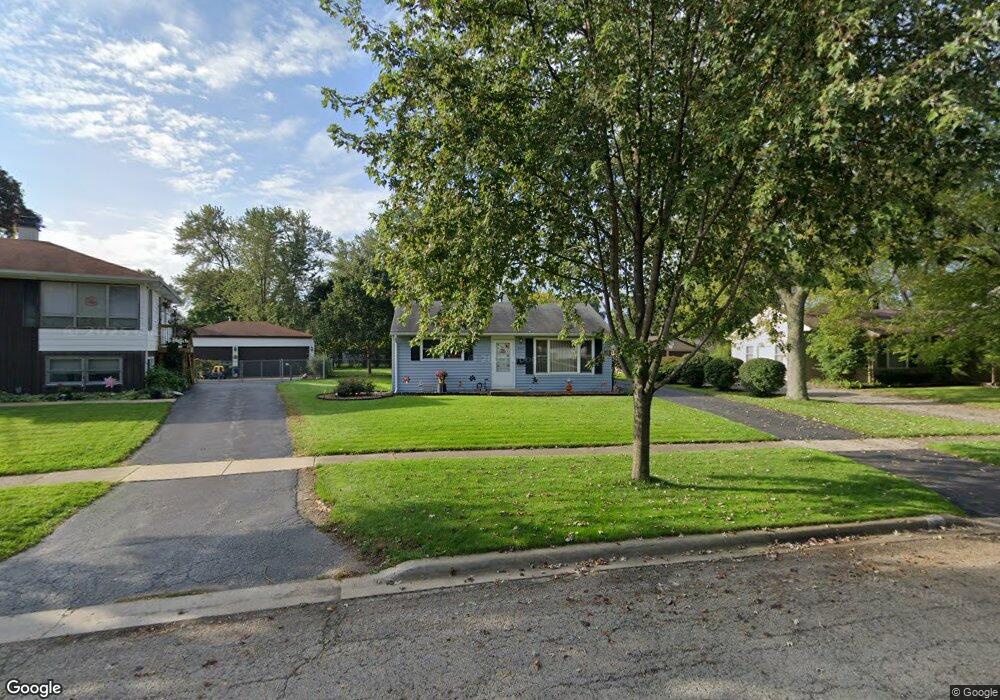
2105 Eastman St Rolling Meadows, IL 60008
Estimated Value: $317,000 - $369,000
3
Beds
2
Baths
1,236
Sq Ft
$279/Sq Ft
Est. Value
About This Home
This home is located at 2105 Eastman St, Rolling Meadows, IL 60008 and is currently estimated at $344,772, approximately $278 per square foot. 2105 Eastman St is a home located in Cook County with nearby schools including Kimball Hill Elementary School, King Elementary School, and Carl Sandburg Junior High School.
Ownership History
Date
Name
Owned For
Owner Type
Purchase Details
Closed on
Sep 7, 1999
Sold by
Magerl Susanne C and Koontz Arlene A
Bought by
Magerl Susanne C
Current Estimated Value
Home Financials for this Owner
Home Financials are based on the most recent Mortgage that was taken out on this home.
Original Mortgage
$162,000
Interest Rate
9.37%
Purchase Details
Closed on
Dec 19, 1995
Sold by
Magerl Susan and Raeside Marion M
Bought by
Magerl Susanne C and Koontz Arlene A
Home Financials for this Owner
Home Financials are based on the most recent Mortgage that was taken out on this home.
Original Mortgage
$154,000
Interest Rate
7.41%
Create a Home Valuation Report for This Property
The Home Valuation Report is an in-depth analysis detailing your home's value as well as a comparison with similar homes in the area
Home Values in the Area
Average Home Value in this Area
Purchase History
| Date | Buyer | Sale Price | Title Company |
|---|---|---|---|
| Magerl Susanne C | -- | Countryside Title Services I | |
| Magerl Susanne C | -- | -- |
Source: Public Records
Mortgage History
| Date | Status | Borrower | Loan Amount |
|---|---|---|---|
| Closed | Magerl Susanne C | $162,000 | |
| Closed | Magerl Susanne C | $154,000 |
Source: Public Records
Tax History Compared to Growth
Tax History
| Year | Tax Paid | Tax Assessment Tax Assessment Total Assessment is a certain percentage of the fair market value that is determined by local assessors to be the total taxable value of land and additions on the property. | Land | Improvement |
|---|---|---|---|---|
| 2024 | $4,143 | $25,586 | $5,789 | $19,797 |
| 2023 | $4,094 | $27,000 | $5,789 | $21,211 |
| 2022 | $4,094 | $27,000 | $5,789 | $21,211 |
| 2021 | $4,277 | $19,575 | $3,420 | $16,155 |
| 2020 | $4,524 | $19,575 | $3,420 | $16,155 |
| 2019 | $4,567 | $21,872 | $3,420 | $18,452 |
| 2018 | $4,917 | $21,363 | $3,157 | $18,206 |
| 2017 | $4,851 | $21,363 | $3,157 | $18,206 |
| 2016 | $5,049 | $21,363 | $3,157 | $18,206 |
| 2015 | $4,777 | $17,795 | $2,894 | $14,901 |
| 2014 | $4,680 | $17,795 | $2,894 | $14,901 |
| 2013 | $4,549 | $17,795 | $2,894 | $14,901 |
Source: Public Records
Map
Nearby Homes
- 1615 W Johanna Terrace
- 617 N Wilke Rd
- 12 S Princeton Ct
- 2611 South St
- 502 S Reuter Dr
- 222 S Dwyer Ave
- 2201 Kingfisher Ln
- 3208 Wren Ln
- 2100 Martin Ln
- 1506 W Northwest Hwy
- 3316 Trillium Cir
- 3125 Town Square Dr Unit 408
- 3265 Kirchoff Rd Unit 223
- 3400 Wellington Ct Unit 306
- 3355 Kirchoff Rd Unit 6A
- 628 S Wilke Rd
- 318 W Wing St
- 314 W Wing St
- 3805 Wren Ln
- 105 S Mitchell Ave