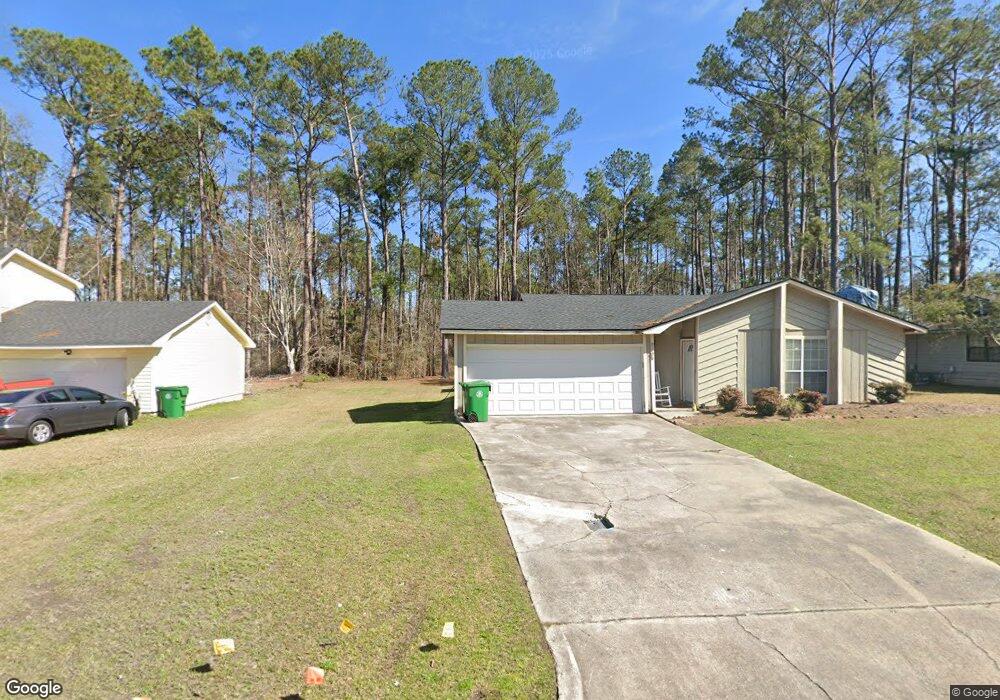
2105 Fallingleaf Ln Valdosta, GA 31602
Estimated Value: $157,209 - $187,000
--
Bed
2
Baths
1,424
Sq Ft
$121/Sq Ft
Est. Value
About This Home
This home is located at 2105 Fallingleaf Ln, Valdosta, GA 31602 and is currently estimated at $171,802, approximately $120 per square foot. 2105 Fallingleaf Ln is a home located in Lowndes County with nearby schools including W.G. Nunn Elementary School, Newbern Middle School, and Valdosta High School.
Ownership History
Date
Name
Owned For
Owner Type
Purchase Details
Closed on
May 21, 2003
Sold by
Terrell Marvin D
Bought by
Terrell Marvin D
Current Estimated Value
Purchase Details
Closed on
Aug 31, 1995
Bought by
Terrell Marvin D
Purchase Details
Closed on
Sep 4, 1991
Bought by
Goodwin Jackie R
Purchase Details
Closed on
Mar 5, 1991
Bought by
Chemical Bank Trustee Fo
Purchase Details
Closed on
Nov 19, 1990
Bought by
Price K Paul
Purchase Details
Closed on
Feb 4, 1987
Bought by
Adm Of Veterans Affairs
Purchase Details
Closed on
Feb 3, 1987
Bought by
Bank South Mortgage Inc
Purchase Details
Closed on
Dec 5, 1985
Bought by
Satre Brian W and Satre Maria A
Purchase Details
Closed on
May 31, 1983
Bought by
Peterson Randall C Etal
Purchase Details
Closed on
Oct 19, 1981
Bought by
Edwards David M Etal
Purchase Details
Closed on
Aug 3, 1981
Bought by
Minchew Construction Co
Create a Home Valuation Report for This Property
The Home Valuation Report is an in-depth analysis detailing your home's value as well as a comparison with similar homes in the area
Home Values in the Area
Average Home Value in this Area
Purchase History
| Date | Buyer | Sale Price | Title Company |
|---|---|---|---|
| Terrell Marvin D | -- | -- | |
| Terrell Marvin D | $58,200 | -- | |
| Goodwin Jackie R | $54,500 | -- | |
| Chemical Bank Trustee Fo | $50,100 | -- | |
| Price K Paul | -- | -- | |
| Adm Of Veterans Affairs | -- | -- | |
| Bank South Mortgage Inc | -- | -- | |
| Satre Brian W | $3,000 | -- | |
| Peterson Randall C Etal | $61,700 | -- | |
| Edwards David M Etal | $56,500 | -- | |
| Minchew Construction Co | $8,700 | -- |
Source: Public Records
Tax History Compared to Growth
Tax History
| Year | Tax Paid | Tax Assessment Tax Assessment Total Assessment is a certain percentage of the fair market value that is determined by local assessors to be the total taxable value of land and additions on the property. | Land | Improvement |
|---|---|---|---|---|
| 2024 | $1,170 | $41,886 | $4,800 | $37,086 |
| 2023 | $1,170 | $41,886 | $4,800 | $37,086 |
| 2022 | $1,059 | $31,340 | $4,800 | $26,540 |
| 2021 | $1,090 | $31,340 | $4,800 | $26,540 |
| 2020 | $1,113 | $31,340 | $4,800 | $26,540 |
| 2019 | $1,113 | $31,340 | $4,800 | $26,540 |
| 2018 | $842 | $23,403 | $4,800 | $18,603 |
| 2017 | $847 | $23,403 | $4,800 | $18,603 |
| 2016 | $846 | $23,403 | $4,800 | $18,603 |
| 2015 | $777 | $23,403 | $4,800 | $18,603 |
| 2014 | $909 | $38,138 | $12,000 | $26,138 |
Source: Public Records
Map
Nearby Homes
- 2019 Fallingleaf Ln
- TBD Jaycee Shack Rd
- 2835 Kirkwood Cir
- 11 Crestwood Cir
- 7.63 AC Tyndall Dr
- 3122 Tyndall Dr
- 3200 Tyndall Dr Unit A/B
- 3202 Tyndall Dr Unit A/B
- 4085 Chadwyck Dr
- 4305 Brandonshire Ln
- 4064 Chadwyck Dr
- 4203 Wilshire Dr
- 1703 Largo Cir
- 3222 Fred Walker Rd
- 3016 Ginny Dr
- 3848 Thoreau Dr
- 3676 Tupelo Rd
- 1647 Fresno St
- 4004 Tack Trail
- 3703 Deidra Miller Cir
- 2107 Fallingleaf Ln
- 2103 Fallingleaf Ln
- 2103 Fallingleaf Ln
- 2109 Fallingleaf Ln
- 2023 Bradley Ave
- 2101 Fallingleaf Ln
- 2200 Fallingleaf Ln
- 3101 Fallingleaf Ln
- 2100 Fallingleaf Ln
- 2102 Meade Ave
- 2022 Bradley Ave
- 2021 Bradley Ave
- 2104 Meade Ave
- 3100 Fallingleaf Ln
- 3103 Fallingleaf Ln
- 2021 Fallingleaf Ln
- 2020 Fallingleaf Ln
- 2106 Meade Ave
- 2020 Bradley Ave
- 2015 Fawnridge Rd