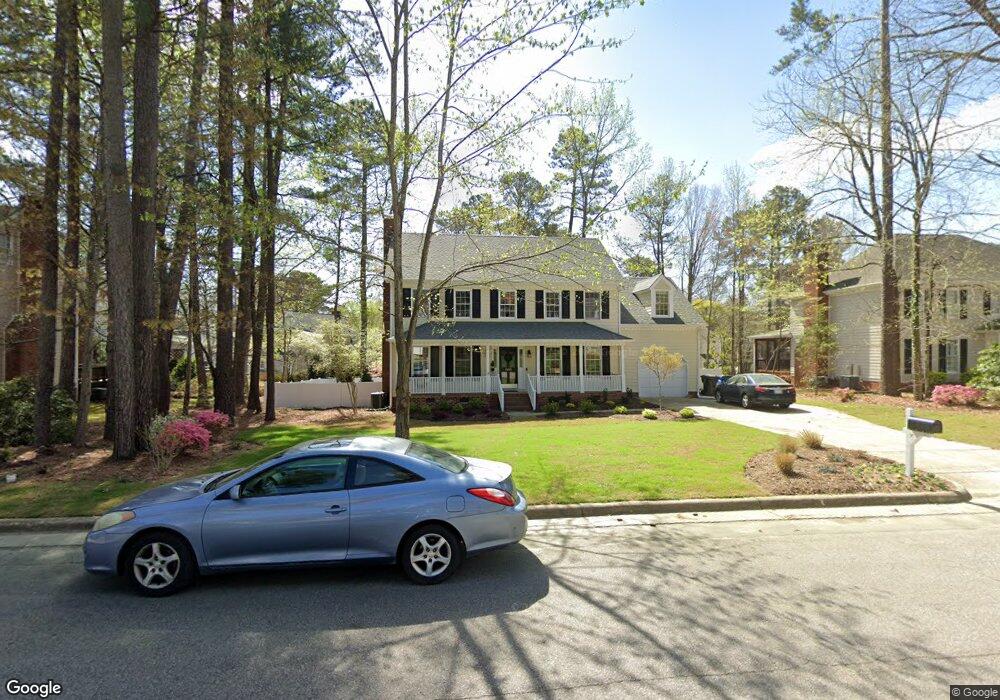
2105 Lodestar Dr Raleigh, NC 27615
Stonehenge East NeighborhoodEstimated Value: $598,000 - $707,000
4
Beds
3
Baths
2,372
Sq Ft
$273/Sq Ft
Est. Value
About This Home
This home is located at 2105 Lodestar Dr, Raleigh, NC 27615 and is currently estimated at $648,725, approximately $273 per square foot. 2105 Lodestar Dr is a home located in Wake County with nearby schools including Lead Mine Elementary School, Carroll Middle, and Sanderson High School.
Ownership History
Date
Name
Owned For
Owner Type
Purchase Details
Closed on
Apr 14, 2021
Sold by
Weber Brian D and Weber Ellen
Bought by
Watson Thomas A and Watson Peyton A
Current Estimated Value
Home Financials for this Owner
Home Financials are based on the most recent Mortgage that was taken out on this home.
Original Mortgage
$348,000
Outstanding Balance
$314,202
Interest Rate
3%
Mortgage Type
New Conventional
Estimated Equity
$334,523
Purchase Details
Closed on
Jul 31, 2015
Sold by
Rogers Lee C and Rogers Elaine B
Bought by
Mcgraw Eilen R and Weber Brian D
Home Financials for this Owner
Home Financials are based on the most recent Mortgage that was taken out on this home.
Original Mortgage
$255,200
Interest Rate
4.04%
Mortgage Type
New Conventional
Purchase Details
Closed on
Nov 23, 1998
Sold by
West Randall L
Bought by
Rogers Lee C and Rogers Elaine B
Home Financials for this Owner
Home Financials are based on the most recent Mortgage that was taken out on this home.
Original Mortgage
$158,400
Interest Rate
6.95%
Create a Home Valuation Report for This Property
The Home Valuation Report is an in-depth analysis detailing your home's value as well as a comparison with similar homes in the area
Home Values in the Area
Average Home Value in this Area
Purchase History
| Date | Buyer | Sale Price | Title Company |
|---|---|---|---|
| Watson Thomas A | $435,000 | None Available | |
| Mcgraw Eilen R | $319,000 | Attorney | |
| Rogers Lee C | $198,000 | -- |
Source: Public Records
Mortgage History
| Date | Status | Borrower | Loan Amount |
|---|---|---|---|
| Open | Watson Thomas A | $348,000 | |
| Previous Owner | Mcgraw Eilen R | $255,200 | |
| Previous Owner | Rogers Lee C | $158,400 |
Source: Public Records
Tax History Compared to Growth
Tax History
| Year | Tax Paid | Tax Assessment Tax Assessment Total Assessment is a certain percentage of the fair market value that is determined by local assessors to be the total taxable value of land and additions on the property. | Land | Improvement |
|---|---|---|---|---|
| 2025 | $4,722 | $539,132 | $205,000 | $334,132 |
| 2024 | $4,702 | $539,132 | $205,000 | $334,132 |
| 2023 | $4,084 | $372,828 | $140,000 | $232,828 |
| 2022 | $3,795 | $372,828 | $140,000 | $232,828 |
| 2021 | $3,648 | $372,828 | $140,000 | $232,828 |
| 2020 | $3,581 | $372,828 | $140,000 | $232,828 |
| 2019 | $3,785 | $324,862 | $142,000 | $182,862 |
| 2018 | $3,569 | $324,862 | $142,000 | $182,862 |
| 2017 | $3,400 | $324,862 | $142,000 | $182,862 |
| 2016 | $3,330 | $324,862 | $142,000 | $182,862 |
| 2015 | -- | $316,403 | $142,000 | $174,403 |
| 2014 | $1,082 | $316,403 | $142,000 | $174,403 |
Source: Public Records
Map
Nearby Homes
- 3008 Eden Harbor Ct
- 7704 Falcon Rest Cir
- 7771 Falcon Rest Cir Unit 7771
- 8420 Caldbeck Dr
- 8825 Leeshire Ln
- 8904 Mildenhall Ct
- 8404 Sleepy Creek Dr
- 8521 Harbor Dr
- 2300 Valley Forge Dr
- 2704 Smokey Ridge Rd
- 8700 Aldersgate Way
- 1516 Bridgeport Dr
- 8337 Greywinds Dr
- 8305 Greywinds Dr
- 7922 Footman Way
- 1308 Hillbrow Ln Unit 203
- 8713 Gleneagles Dr
- 1432 Quarter Point
- 8604 Wellsley Way
- 8605 Brookdale Dr
- 2109 Lodestar Dr
- 2101 Lodestar Dr
- 2104 Brixham Ct
- 2141 Hamrick Dr
- 2137 Hamrick Dr
- 2104 Lodestar Dr
- 2108 Lodestar Dr
- 2201 Hamrick Dr
- 2133 Hamrick Dr
- 2100 Brixham Ct
- 2113 Lodestar Dr
- 2144 Hamrick Dr
- 2129 Hamrick Dr
- 2200 Durweston Ct
- 2205 Hamrick Dr
- 2204 Durweston Ct
- 2109 Brixham Ct
- 2101 Brixham Ct
- 2208 Durweston Ct
- 2140 Hamrick Dr