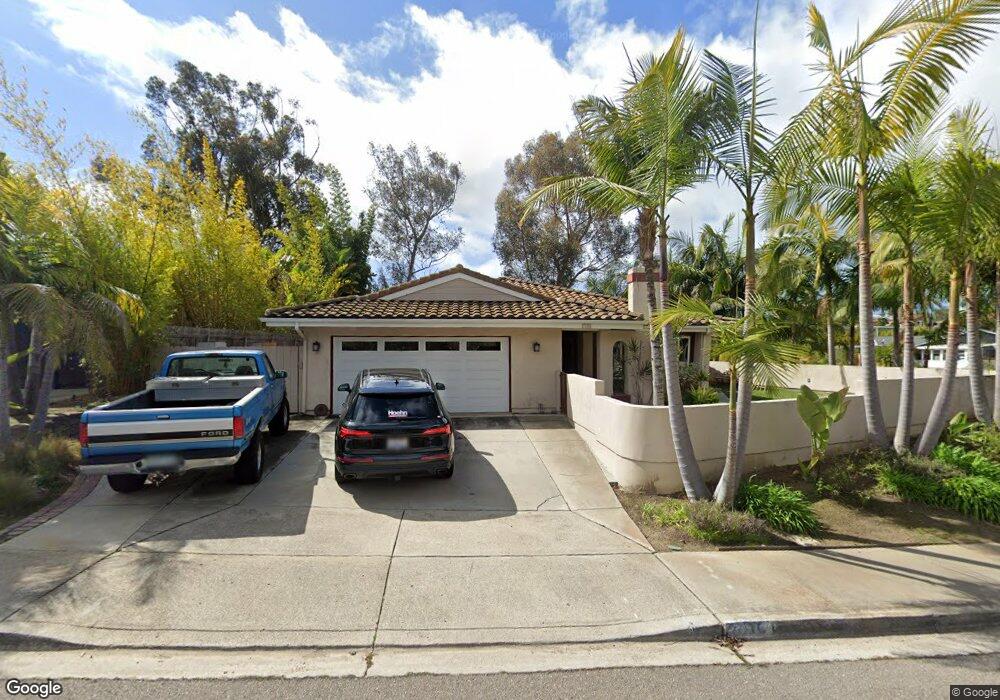
2105 Redgap Ct Encinitas, CA 92024
Central Encinitas NeighborhoodEstimated Value: $1,716,168 - $1,802,000
3
Beds
2
Baths
1,746
Sq Ft
$999/Sq Ft
Est. Value
About This Home
This home is located at 2105 Redgap Ct, Encinitas, CA 92024 and is currently estimated at $1,743,792, approximately $998 per square foot. 2105 Redgap Ct is a home located in San Diego County with nearby schools including Park Dale Lane Elementary, Diegueno Middle School, and La Costa Canyon High School.
Ownership History
Date
Name
Owned For
Owner Type
Purchase Details
Closed on
Nov 17, 2014
Sold by
Stephenson Robert L and Stephenson Arlene
Bought by
Moon Rickie L and Stephenson Robert L
Current Estimated Value
Home Financials for this Owner
Home Financials are based on the most recent Mortgage that was taken out on this home.
Original Mortgage
$262,100
Outstanding Balance
$199,810
Interest Rate
3.87%
Mortgage Type
Adjustable Rate Mortgage/ARM
Estimated Equity
$1,543,982
Purchase Details
Closed on
Mar 18, 2011
Sold by
Copp Nelson W and Copp Debra L
Bought by
Stephenson Robert L and Stephenson Arlene
Home Financials for this Owner
Home Financials are based on the most recent Mortgage that was taken out on this home.
Original Mortgage
$399,750
Outstanding Balance
$273,760
Interest Rate
4.72%
Mortgage Type
New Conventional
Estimated Equity
$1,470,032
Purchase Details
Closed on
Dec 3, 2007
Sold by
Copp Nelson W and Copp Debra L
Bought by
Copp Nelson W and Copp Debra L
Create a Home Valuation Report for This Property
The Home Valuation Report is an in-depth analysis detailing your home's value as well as a comparison with similar homes in the area
Home Values in the Area
Average Home Value in this Area
Purchase History
| Date | Buyer | Sale Price | Title Company |
|---|---|---|---|
| Moon Rickie L | -- | American Coast Title Company | |
| Stephenson Robert L | $533,500 | Equity Title San Diego | |
| Copp Nelson W | -- | None Available |
Source: Public Records
Mortgage History
| Date | Status | Borrower | Loan Amount |
|---|---|---|---|
| Open | Moon Rickie L | $262,100 | |
| Open | Stephenson Robert L | $399,750 |
Source: Public Records
Tax History
| Year | Tax Paid | Tax Assessment Tax Assessment Total Assessment is a certain percentage of the fair market value that is determined by local assessors to be the total taxable value of land and additions on the property. | Land | Improvement |
|---|---|---|---|---|
| 2025 | $7,719 | $683,493 | $279,011 | $404,482 |
| 2024 | $7,719 | $670,092 | $273,541 | $396,551 |
| 2023 | $7,496 | $656,954 | $268,178 | $388,776 |
| 2022 | $7,315 | $644,073 | $262,920 | $381,153 |
| 2021 | $7,190 | $631,445 | $257,765 | $373,680 |
| 2020 | $7,071 | $624,971 | $255,122 | $369,849 |
| 2019 | $6,933 | $612,718 | $250,120 | $362,598 |
| 2018 | $6,802 | $600,705 | $245,216 | $355,489 |
| 2017 | $6,686 | $588,927 | $240,408 | $348,519 |
| 2016 | $6,481 | $577,381 | $235,695 | $341,686 |
| 2015 | $6,364 | $568,709 | $232,155 | $336,554 |
| 2014 | $6,219 | $557,570 | $227,608 | $329,962 |
Source: Public Records
Map
Nearby Homes
- 1926 Springdale Ln
- 277 Via Del Cerrito
- 1741 Charleston Ln
- 121 Avenida Esperanza
- 2118 Valleydale Ln
- 1822 Stanton Rd Unit 302
- 516 Whisper Wind Dr
- 245 Fairlee Ln
- 1982 Fairlee Dr
- 1824 Eastwood Ln
- 1644 Forestdale Dr
- 1830 Gatepost Rd
- 324 Countrywood Ln
- 2037 Countrywood Way
- 612 Lucylle Ln
- 1971 Azure Way
- 349 Horizon Dr
- 1549 Avenida de Las Adelsas
- 803 Hollyridge Dr
- 1517 Shields Ave
- 2113 Redgap Ct
- 2119 Redgap Ct
- 2102 Pleasant Grove Rd
- 2088 Village Wood Rd
- 2108 Redgap Ct
- 2114 Redgap Ct
- 2102 Redgap Ct
- 2106 Pleasant Grove Rd
- 2082 Village Wood Rd
- 2125 Redgap Ct
- 2093 Village Wood Rd
- 2120 Redgap Ct
- 109 Blue Ash Ct
- 2110 Pleasant Grove Rd
- 115 Blue Ash Ct
- 2132 Redgap Ct
- 2126 Redgap Ct
- 2111 Brigantine Ct
- 2117 Brigantine Ct
- 2074 Village Wood Rd
Your Personal Tour Guide
Ask me questions while you tour the home.