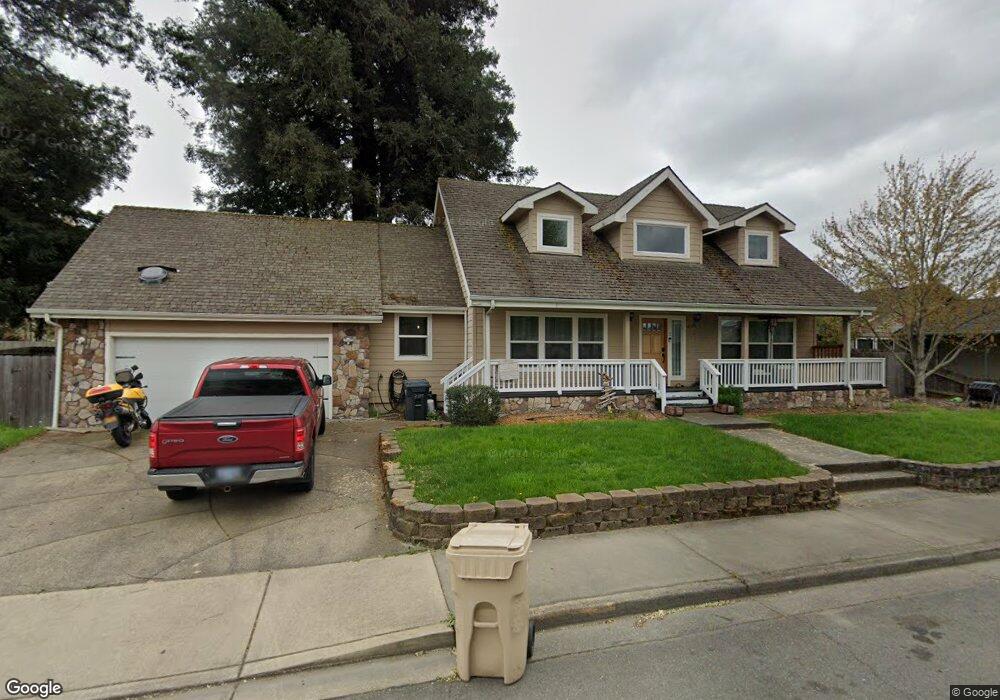
2105 SW Bridge St Grants Pass, OR 97526
Estimated Value: $416,000 - $420,455
3
Beds
3
Baths
2,000
Sq Ft
$209/Sq Ft
Est. Value
About This Home
This home is located at 2105 SW Bridge St, Grants Pass, OR 97526 and is currently estimated at $418,228, approximately $209 per square foot. 2105 SW Bridge St is a home located in Josephine County with nearby schools including Ft. Vannoy Elementary School, Fleming Middle School, and North Valley High School.
Ownership History
Date
Name
Owned For
Owner Type
Purchase Details
Closed on
Feb 22, 2021
Sold by
Hughes Brandy Marie
Bought by
Hughes Jon A
Current Estimated Value
Purchase Details
Closed on
Oct 1, 2009
Sold by
West Coast Bank
Bought by
Hughes Jon A and Hughes Brandy Marie
Home Financials for this Owner
Home Financials are based on the most recent Mortgage that was taken out on this home.
Original Mortgage
$211,993
Interest Rate
5.08%
Mortgage Type
FHA
Purchase Details
Closed on
Aug 13, 2007
Sold by
Hyde Matthew
Bought by
West Coast Bancorp and West Coast Bank
Purchase Details
Closed on
Jun 15, 2006
Sold by
Lincoln Meadows Llc
Bought by
Hyde Matthew
Home Financials for this Owner
Home Financials are based on the most recent Mortgage that was taken out on this home.
Original Mortgage
$289,000
Interest Rate
6.57%
Mortgage Type
Fannie Mae Freddie Mac
Create a Home Valuation Report for This Property
The Home Valuation Report is an in-depth analysis detailing your home's value as well as a comparison with similar homes in the area
Home Values in the Area
Average Home Value in this Area
Purchase History
| Date | Buyer | Sale Price | Title Company |
|---|---|---|---|
| Hughes Jon A | -- | None Listed On Document | |
| Hughes Jon A | $215,904 | Fa | |
| West Coast Bancorp | -- | Fa | |
| Hyde Matthew | $115,000 | Ticor Title |
Source: Public Records
Mortgage History
| Date | Status | Borrower | Loan Amount |
|---|---|---|---|
| Previous Owner | Hughes Jon A | $211,993 | |
| Previous Owner | Hyde Matthew | $289,000 |
Source: Public Records
Tax History Compared to Growth
Tax History
| Year | Tax Paid | Tax Assessment Tax Assessment Total Assessment is a certain percentage of the fair market value that is determined by local assessors to be the total taxable value of land and additions on the property. | Land | Improvement |
|---|---|---|---|---|
| 2025 | $2,965 | $242,850 | -- | -- |
| 2024 | $2,965 | $235,780 | -- | -- |
| 2023 | $2,793 | $228,920 | $0 | $0 |
| 2022 | $2,807 | $222,260 | -- | -- |
| 2021 | $2,636 | $215,790 | $0 | $0 |
| 2020 | $2,656 | $209,510 | $0 | $0 |
| 2019 | $2,562 | $203,410 | $0 | $0 |
| 2018 | $2,626 | $197,490 | $0 | $0 |
| 2017 | $2,618 | $191,740 | $0 | $0 |
| 2016 | $2,298 | $186,160 | $0 | $0 |
| 2015 | $2,224 | $180,740 | $0 | $0 |
| 2014 | $2,164 | $175,480 | $0 | $0 |
Source: Public Records
Map
Nearby Homes
- 738 Lincoln Rd
- 789 Tami Rd
- 2082 Lower River Rd
- 1990 SW Betty Ln
- 1986 SW Betty Ln
- 1950 SW Betty Ln
- 901 Schaefers Ln
- 2308 Lower River Rd
- 600 Roguelea Ln
- 127 Brentwood Dr
- 930 Schaefers Ln
- 115 Orangewood Dr
- 1719 SW Bridge St
- 737 SW Kinsington Ct
- 965 Roguelea Ln
- 795 Bentley Dr
- 751 SW Kinsington Ct
- 1126 SW Cottonwood St
- 753 SW Kinsington Ct
- 300 Winston Dr
- 108 SW Vicki Ln
- 2147 SW Bridge St
- 114 SW Vicki Ln
- 657 SW Balsam Rd
- 2153 SW Bridge St
- 2106 SW Bridge St
- 115 SW Vicki Ln
- 120 SW Vicki Ln
- 653 SW Balsam Rd
- 121 SW Vicki Ln
- 650 SW Balsam Rd
- 647 SW Balsam Rd
- 733 Tami Rd
- 727 Tami Rd
- 2159 SW Bridge St
- 126 SW Vicki Ln
- 127 SW Vicki Ln
- 648 Lincoln Rd
- 739 Tami Rd
- 2165 SW Bridge St