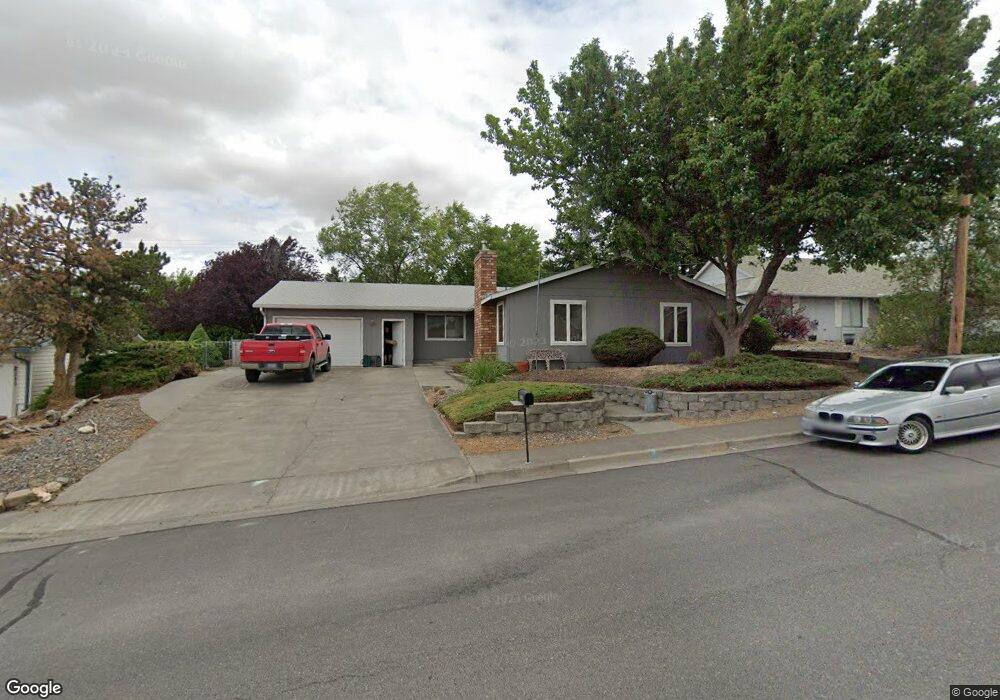
2105 SW Perkins Ave Pendleton, OR 97801
Estimated Value: $332,596 - $362,000
3
Beds
2
Baths
1,632
Sq Ft
$212/Sq Ft
Est. Value
About This Home
This home is located at 2105 SW Perkins Ave, Pendleton, OR 97801 and is currently estimated at $345,649, approximately $211 per square foot. 2105 SW Perkins Ave is a home located in Umatilla County with nearby schools including McKay Creek Elementary School, Sunridge Middle School, and Pendleton High School.
Ownership History
Date
Name
Owned For
Owner Type
Purchase Details
Closed on
Jun 4, 2013
Sold by
Corley Ruth E
Bought by
Corley Ruth E
Current Estimated Value
Purchase Details
Closed on
Feb 19, 2013
Sold by
Corley Ruth E
Bought by
Emert Craig R and Emert Lindsay L
Home Financials for this Owner
Home Financials are based on the most recent Mortgage that was taken out on this home.
Original Mortgage
$173,552
Outstanding Balance
$118,895
Interest Rate
3.36%
Mortgage Type
VA
Estimated Equity
$226,754
Purchase Details
Closed on
May 25, 2007
Sold by
Royal W Wayne and Royal Barbara J
Bought by
Corley Theodore W and Corley Ruth E
Home Financials for this Owner
Home Financials are based on the most recent Mortgage that was taken out on this home.
Original Mortgage
$152,000
Interest Rate
6.12%
Mortgage Type
New Conventional
Purchase Details
Closed on
Mar 17, 2006
Sold by
Maxwell Darrell C and Maxwell Betty J
Bought by
Royal W Wayne and Royal Barbara J
Create a Home Valuation Report for This Property
The Home Valuation Report is an in-depth analysis detailing your home's value as well as a comparison with similar homes in the area
Home Values in the Area
Average Home Value in this Area
Purchase History
| Date | Buyer | Sale Price | Title Company |
|---|---|---|---|
| Corley Ruth E | -- | None Available | |
| Emert Craig R | $169,900 | Amerititle | |
| Corley Theodore W | $160,000 | Pioneer Title Co | |
| Royal W Wayne | $156,000 | Amerititle |
Source: Public Records
Mortgage History
| Date | Status | Borrower | Loan Amount |
|---|---|---|---|
| Open | Emert Craig R | $173,552 | |
| Previous Owner | Corley Theodore W | $152,000 |
Source: Public Records
Tax History
| Year | Tax Paid | Tax Assessment Tax Assessment Total Assessment is a certain percentage of the fair market value that is determined by local assessors to be the total taxable value of land and additions on the property. | Land | Improvement |
|---|---|---|---|---|
| 2025 | $3,344 | $213,150 | $56,760 | $156,390 |
| 2023 | $3,187 | $200,930 | $53,510 | $147,420 |
| 2022 | $3,006 | $195,080 | $0 | $0 |
| 2021 | $3,023 | $189,400 | $50,440 | $138,960 |
| 2020 | $2,920 | $183,890 | $48,970 | $134,920 |
| 2018 | $2,771 | $173,340 | $46,160 | $127,180 |
| 2017 | $2,650 | $168,300 | $44,810 | $123,490 |
| 2016 | $2,445 | $163,400 | $43,510 | $119,890 |
| 2015 | $2,418 | $150,970 | $43,260 | $107,710 |
| 2014 | $2,425 | $150,970 | $43,260 | $107,710 |
Source: Public Records
Map
Nearby Homes
- 1414 SW 24th St
- 1206 SW 24th St
- 0 SW Quinney Ln Unit 24414661
- 1741 SW 18th St
- 0 SW 30th Unit 22542685
- 0 SW Ladow Ave Unit Lot 41
- 0 SW Ladow Ave Unit Lot 42
- 0 SW Ladow Ave Unit Lot 43
- 722 SW 28th St
- 3 Tutuilla Rd
- 715 SW 27th St
- 726 SW 22nd St
- 1209 SW Zeta Ct
- 1394 SW Tutuilla Creek Rd
- 1 SW Tutuilla Creek Rd
- 2 SW Tutuilla Creek Rd
- 1394 Tutuilla Rd
- 3307 SW Kirk Ave
- 0 SW Kirk Ave Unit 200 21392184
- 0 SW Kirk Ave Unit 101 21527345
- 2021 SW Perkins Ave
- 2111 SW Perkins Ave
- 2104 SW Olson Ave
- 2108 SW Olson Ave
- 2017 SW Perkins Ave
- 2104 SW Perkins Ave
- 2110 SW Perkins Ave
- 2012 SW Perkins Ave
- 2020 SW Olson Ave
- 2003 SW 18th St
- 2014 SW Olson Ave
- 2013 SW Perkins Ave
- 2211 SW Perkins Ave
- 2204 SW Perkins Ave
- 2008 SW Perkins Ave
- 2210 SW Perkins Ave
- 2009 SW Perkins Ave
- 2005 SW Perkins Ave
- 2111 SW Olson Ave
Your Personal Tour Guide
Ask me questions while you tour the home.