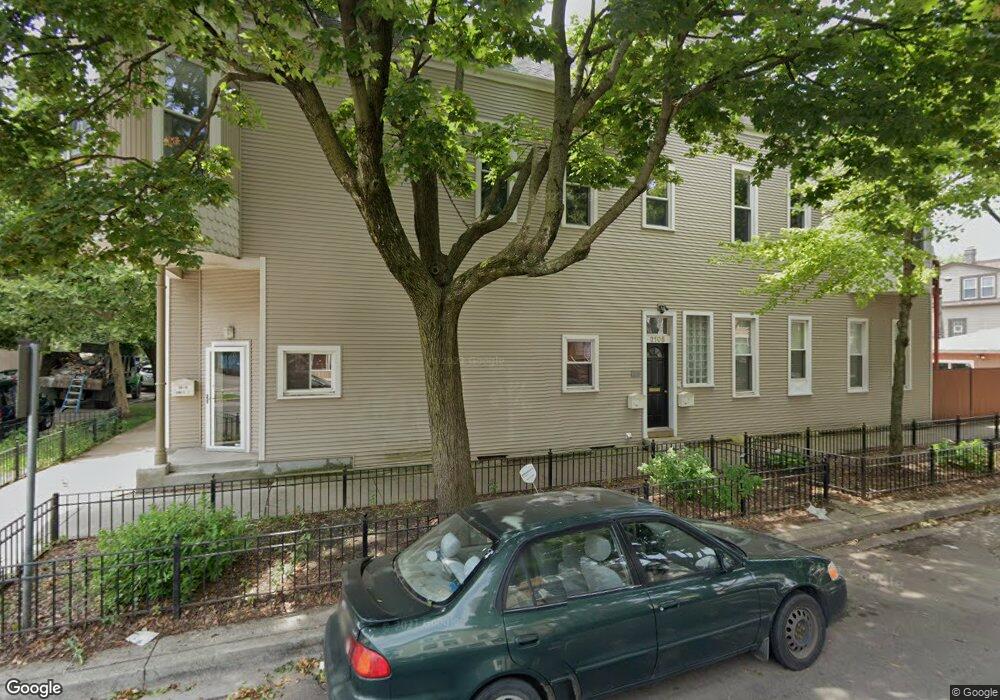
2105 W Barry Ave Unit G1 Chicago, IL 60618
Roscoe Village NeighborhoodEstimated Value: $377,000 - $779,000
--
Bed
--
Bath
--
Sq Ft
2,962
Sq Ft Lot
About This Home
This home is located at 2105 W Barry Ave Unit G1, Chicago, IL 60618 and is currently estimated at $540,352. 2105 W Barry Ave Unit G1 is a home located in Cook County with nearby schools including Jahn School of Fine Arts, Lake View High School, and Saint Luke Academy.
Ownership History
Date
Name
Owned For
Owner Type
Purchase Details
Closed on
Jan 27, 2025
Sold by
Michael A Styrna Trust and Styrna Michael A
Bought by
Styrna Brittany
Current Estimated Value
Purchase Details
Closed on
Aug 15, 2022
Sold by
Bregger Matthew P and Bregger Melissa D
Bought by
Michael A Styrna Trust
Home Financials for this Owner
Home Financials are based on the most recent Mortgage that was taken out on this home.
Original Mortgage
$292,000
Interest Rate
5.99%
Mortgage Type
New Conventional
Purchase Details
Closed on
Jun 3, 2015
Sold by
Johnson Ryan and Johnson Erica
Bought by
Bregger Matthew P and Bregger Melissa D
Home Financials for this Owner
Home Financials are based on the most recent Mortgage that was taken out on this home.
Original Mortgage
$286,400
Interest Rate
3.87%
Mortgage Type
New Conventional
Create a Home Valuation Report for This Property
The Home Valuation Report is an in-depth analysis detailing your home's value as well as a comparison with similar homes in the area
Home Values in the Area
Average Home Value in this Area
Purchase History
| Date | Buyer | Sale Price | Title Company |
|---|---|---|---|
| Styrna Brittany | -- | None Listed On Document | |
| Michael A Styrna Trust | $365,000 | Stewart Title Company | |
| Bregger Matthew P | $358,000 | None Available |
Source: Public Records
Mortgage History
| Date | Status | Borrower | Loan Amount |
|---|---|---|---|
| Previous Owner | Michael A Styrna Trust | $292,000 | |
| Previous Owner | Bregger Matthew P | $286,400 |
Source: Public Records
Tax History Compared to Growth
Tax History
| Year | Tax Paid | Tax Assessment Tax Assessment Total Assessment is a certain percentage of the fair market value that is determined by local assessors to be the total taxable value of land and additions on the property. | Land | Improvement |
|---|---|---|---|---|
| 2024 | $211 | $3,087 | $916 | $2,171 |
| 2023 | $206 | $1,000 | $500 | $500 |
| 2022 | $206 | $1,000 | $500 | $500 |
| 2021 | $201 | $1,000 | $500 | $500 |
| 2020 | $638 | $2,864 | $354 | $2,510 |
| 2019 | $635 | $3,159 | $354 | $2,805 |
| 2018 | $624 | $3,159 | $354 | $2,805 |
| 2017 | $645 | $2,995 | $310 | $2,685 |
| 2016 | $600 | $2,995 | $310 | $2,685 |
| 2015 | $549 | $2,995 | $310 | $2,685 |
| 2014 | $517 | $2,785 | $238 | $2,547 |
| 2013 | -- | $2,785 | $238 | $2,547 |
Source: Public Records
Map
Nearby Homes
- 3040 N Hoyne Ave
- 3137 N Hoyne Ave
- 2020 W Barry Ave
- 2043 W Belmont Ave Unit 3
- 3015 N Hamilton Ave
- 2027 W Belmont Ave Unit 1
- 2141 W Belmont Ave Unit 3
- 3002 N Hoyne Ave
- 2149 W Belmont Ave Unit 3W
- 2130 W Belmont Ave Unit 3A
- 3140 N Leavitt St
- 2140 W Belmont Ave Unit 1
- 2209 W Belmont Ave Unit 3
- 3009 N Damen Ave Unit 2
- 2034 W Melrose St
- 2933 N Clybourn Ave Unit 204
- 1935 W Belmont Ave Unit 2
- 2222 W Belmont Ave Unit 504
- 1955 W Melrose St Unit 2
- 1929 W Belmont Ave Unit 2
- 2105 W Barry Ave Unit 21051
- 2105 W Barry Ave Unit 21052
- 2105 W Barry Ave Unit 1
- 2105 W Barry Ave Unit 2
- 3058 N Hoyne Ave Unit 2
- 3058 N Hoyne Ave Unit 30582
- 3058 N Hoyne Ave Unit 30581
- 3058 N Hoyne Ave Unit 1
- 3056 N Hoyne Ave
- 3052 N Hoyne Ave
- 3050 N Hoyne Ave
- 3048 N Hoyne Ave
- 3046 N Hoyne Ave
- 2102 W Barry Ave Unit 1
- 2102 W Barry Ave
- 2102 W Barry Ave
- 2102 W Barry Ave Unit GARDEN
- 2100 W Barry Ave
- 2100 W Barry Ave
- 2100 W Barry Ave Unit 1R