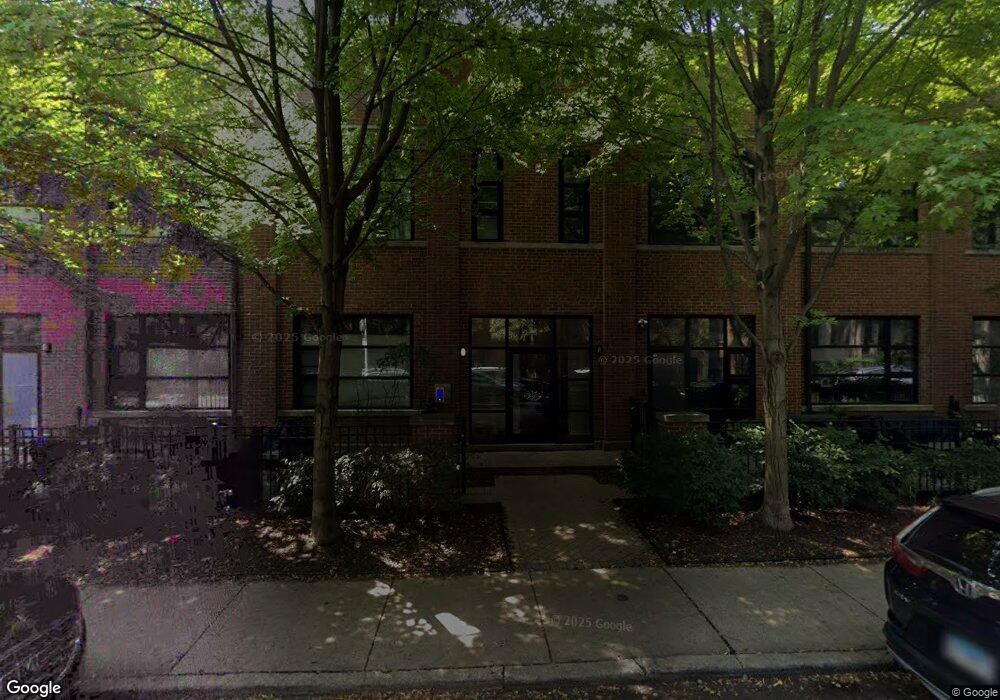
2105 W Concord Place Unit P1 Chicago, IL 60647
Wicker Park NeighborhoodEstimated Value: $536,000
--
Bed
--
Bath
11,130
Sq Ft
$48/Sq Ft
Est. Value
About This Home
This home is located at 2105 W Concord Place Unit P1, Chicago, IL 60647 and is currently estimated at $536,000, approximately $48 per square foot. 2105 W Concord Place Unit P1 is a home located in Cook County with nearby schools including A.N. Pritzker School, Clemente Community Academy High School, and Guidepost Montessori at Wicker Park.
Ownership History
Date
Name
Owned For
Owner Type
Purchase Details
Closed on
Aug 20, 2019
Sold by
Branding Matthew L and Branding Lindsey Dale Moore
Bought by
Eagle Kenneth and Eagle Rachael
Current Estimated Value
Home Financials for this Owner
Home Financials are based on the most recent Mortgage that was taken out on this home.
Original Mortgage
$418,125
Outstanding Balance
$360,336
Interest Rate
2.95%
Mortgage Type
Adjustable Rate Mortgage/ARM
Estimated Equity
$175,664
Purchase Details
Closed on
May 7, 2015
Sold by
Sundberg Cody Joel
Bought by
Branding Matthew L and Moore Lindsey D
Home Financials for this Owner
Home Financials are based on the most recent Mortgage that was taken out on this home.
Original Mortgage
$73,451
Interest Rate
3.25%
Mortgage Type
Credit Line Revolving
Create a Home Valuation Report for This Property
The Home Valuation Report is an in-depth analysis detailing your home's value as well as a comparison with similar homes in the area
Home Values in the Area
Average Home Value in this Area
Purchase History
| Date | Buyer | Sale Price | Title Company |
|---|---|---|---|
| Eagle Kenneth | $557,500 | North American Title Company | |
| Branding Matthew L | $490,000 | Prism Title |
Source: Public Records
Mortgage History
| Date | Status | Borrower | Loan Amount |
|---|---|---|---|
| Open | Eagle Kenneth | $418,125 | |
| Previous Owner | Branding Matthew L | $73,451 | |
| Previous Owner | Branding Matthew L | $367,500 |
Source: Public Records
Tax History Compared to Growth
Tax History
| Year | Tax Paid | Tax Assessment Tax Assessment Total Assessment is a certain percentage of the fair market value that is determined by local assessors to be the total taxable value of land and additions on the property. | Land | Improvement |
|---|---|---|---|---|
| 2024 | $478 | $3,155 | $699 | $2,456 |
| 2023 | $464 | $2,257 | $319 | $1,938 |
| 2022 | $464 | $2,257 | $319 | $1,938 |
| 2021 | $617 | $2,257 | $319 | $1,938 |
| 2020 | $617 | $2,769 | $319 | $2,450 |
| 2019 | $608 | $3,028 | $319 | $2,709 |
| 2018 | $598 | $3,028 | $319 | $2,709 |
| 2017 | $514 | $2,386 | $280 | $2,106 |
| 2016 | $478 | $2,386 | $280 | $2,106 |
| 2015 | $437 | $2,386 | $280 | $2,106 |
| 2014 | $402 | $2,167 | $249 | $1,918 |
| 2013 | -- | $2,576 | $249 | $2,327 |
Source: Public Records
Map
Nearby Homes
- 2113 W Concord Place
- 2130 W North Ave Unit 303
- 2052 W North Ave Unit 2E
- 2150 W North Ave Unit 4
- 2138 W Caton St
- 1646 N Leavitt St
- 1552 N Leavitt St Unit 1552
- 2035 W Saint Paul Ave
- 2201 W Wabansia Ave Unit 11
- 2219 W Wabansia Ave Unit 3
- 1701 N Damen Ave Unit 107
- 1724 N Winnebago Ave Unit B
- 1452 N Leavitt St Unit 3
- 2111 W Churchill St Unit 105
- 1618 N Oakley Ave Unit 2S
- 1525 N Wicker Park Ave Unit 1
- 1732 N Winchester Ave
- 2251 W Saint Paul Ave Unit 2D
- 1804 N Leavitt St
- 1407 N Hoyne Ave
- 2105 W Concord Place Unit P9
- 2105 W Concord Place Unit P7
- 2105 W Concord Place Unit P6
- 2105 W Concord Place Unit P5
- 2105 W Concord Place Unit P4
- 2105 W Concord Place Unit P3
- 2105 W Concord Place Unit P2
- 2105 W Concord Place Unit 7
- 2105 W Concord Place Unit 6
- 2105 W Concord Place Unit 5
- 2105 W Concord Place Unit 4
- 2105 W Concord Place Unit 3
- 2105 W Concord Place Unit 1
- 2105 W Concord Place Unit P8
- 2105 W Concord Place Unit 2
- 1660 N Hoyne Ave
- 2113 W Concord Place Unit 2
- 2113 W Concord Place Unit 1
- 2110 W North Ave Unit 2110
- 2110 W North Ave Unit 2110