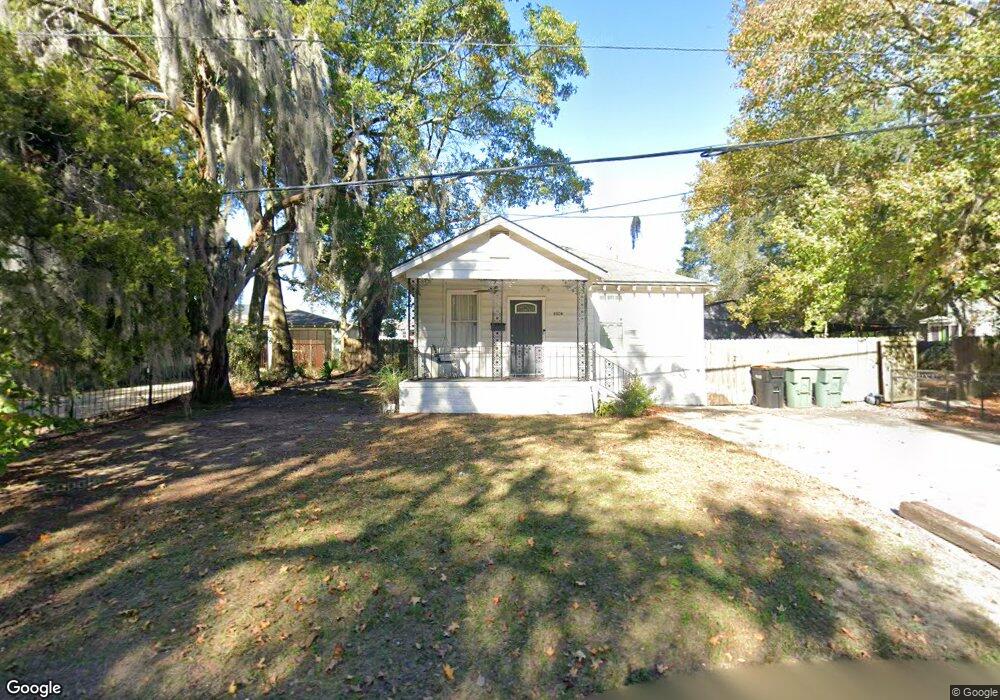
2106 Bolling St Savannah, GA 31404
East Savannah NeighborhoodEstimated Value: $340,000 - $387,000
3
Beds
2
Baths
1,652
Sq Ft
$219/Sq Ft
Est. Value
About This Home
This home is located at 2106 Bolling St, Savannah, GA 31404 and is currently estimated at $361,231, approximately $218 per square foot. 2106 Bolling St is a home located in Chatham County with nearby schools including Shuman Elementary School, Hubert Middle School, and Savannah Arts Academy.
Ownership History
Date
Name
Owned For
Owner Type
Purchase Details
Closed on
Sep 16, 2022
Sold by
Momyer Olivia W
Bought by
Williams Olivia and Russell Monford Darr
Current Estimated Value
Purchase Details
Closed on
Sep 30, 2020
Sold by
Julian Buick
Bought by
Momyer Olivia W
Home Financials for this Owner
Home Financials are based on the most recent Mortgage that was taken out on this home.
Original Mortgage
$186,900
Interest Rate
2.9%
Mortgage Type
New Conventional
Purchase Details
Closed on
Dec 9, 2019
Sold by
Seidl Alice Frost
Bought by
Sunnydale Productions Llc
Purchase Details
Closed on
Jun 23, 2017
Sold by
Seidl Alice Frost
Bought by
Timber & Tide Inc
Home Financials for this Owner
Home Financials are based on the most recent Mortgage that was taken out on this home.
Original Mortgage
$54,500
Interest Rate
3.95%
Mortgage Type
Purchase Money Mortgage
Create a Home Valuation Report for This Property
The Home Valuation Report is an in-depth analysis detailing your home's value as well as a comparison with similar homes in the area
Home Values in the Area
Average Home Value in this Area
Purchase History
| Date | Buyer | Sale Price | Title Company |
|---|---|---|---|
| Williams Olivia | -- | -- | |
| Momyer Olivia W | $186,900 | -- | |
| Sunnydale Productions Llc | -- | -- | |
| Timber & Tide Inc | $62,000 | -- |
Source: Public Records
Mortgage History
| Date | Status | Borrower | Loan Amount |
|---|---|---|---|
| Previous Owner | Momyer Olivia W | $186,900 | |
| Previous Owner | Timber & Tide Inc | $54,500 |
Source: Public Records
Tax History Compared to Growth
Tax History
| Year | Tax Paid | Tax Assessment Tax Assessment Total Assessment is a certain percentage of the fair market value that is determined by local assessors to be the total taxable value of land and additions on the property. | Land | Improvement |
|---|---|---|---|---|
| 2025 | $5,039 | $156,120 | $16,800 | $139,320 |
| 2024 | $5,039 | $154,640 | $16,800 | $137,840 |
| 2023 | $3,947 | $135,160 | $12,000 | $123,160 |
| 2022 | $1,026 | $84,120 | $12,000 | $72,120 |
| 2021 | $3,602 | $66,360 | $4,840 | $61,520 |
| 2020 | $544 | $19,720 | $4,840 | $14,880 |
| 2019 | $940 | $17,240 | $4,840 | $12,400 |
| 2018 | $642 | $11,000 | $4,840 | $6,160 |
| 2017 | $1,060 | $10,000 | $3,720 | $6,280 |
| 2016 | $296 | $10,160 | $3,720 | $6,440 |
| 2015 | $770 | $13,720 | $3,720 | $10,000 |
| 2014 | $761 | $13,720 | $0 | $0 |
Source: Public Records
Map
Nearby Homes
- 2018 Bolling St
- 2157 California Ave
- 2130 Hanson St
- 2139 Mississippi Ave Unit 2
- 2110 Louisiana Ave
- 2151 Mississippi Ave
- 518 Gordonston Ave
- 519 Vinson Ave
- 0 Mosley St Unit SA345182
- 0 Mosley St Unit 10657096
- 2231 E Gwinnett St
- 2125 Florida Ave
- 525 Durant Ave
- 2309 Florida Ave
- 1812 E Gwinnett St
- 2230 Iowa St
- 2113 Texas Ave
- 2413 Mississippi Ave
- 2420 Louisiana Ave
- 2405 New York Ave
- 2104 Bolling St
- 2110 Bolling St
- 2102 Bolling St
- 2103 Bolling St
- 2112 Bolling St
- 2101 Bolling St
- 2029 E Gwinnett St
- 2105 Bolling St
- 2114 Bolling St
- 2107 Bolling St
- 2103 E Gwinnett St
- 2109 Bolling St
- 2026 Bolling St
- 2111 Bolling St
- 2116 Bolling St
- 2108 Alaska St
- 2027 Bolling St
- 2106 Alaska St
- 2024 Bolling St
- 2113 Bolling St