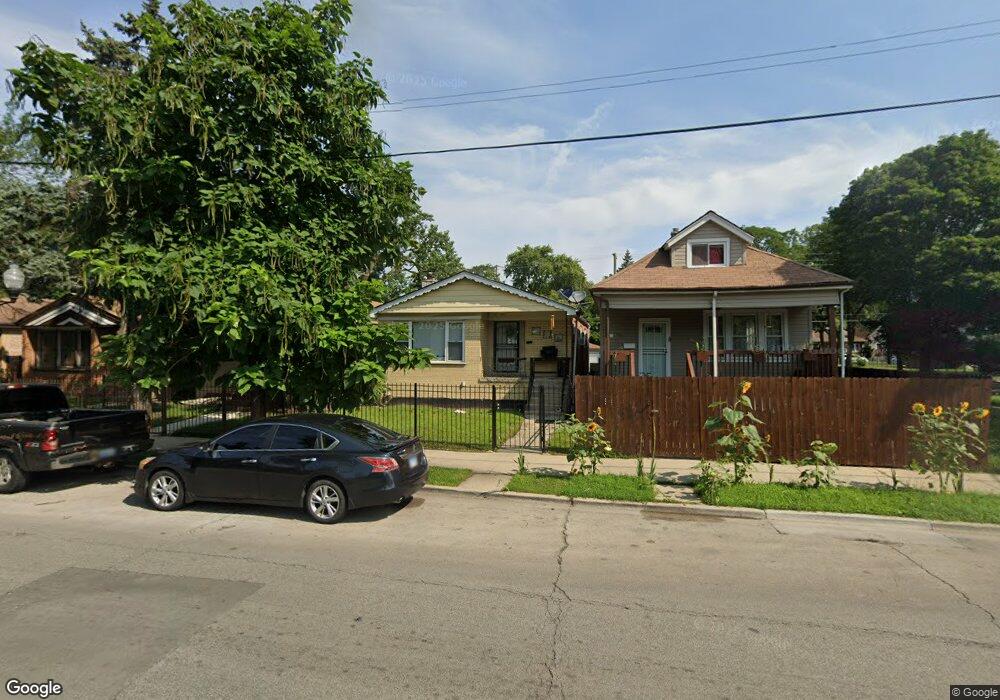
2106 W 69th St Chicago, IL 60636
Englewood NeighborhoodEstimated Value: $96,000 - $205,000
3
Beds
1
Bath
1,086
Sq Ft
$154/Sq Ft
Est. Value
About This Home
This home is located at 2106 W 69th St, Chicago, IL 60636 and is currently estimated at $167,556, approximately $154 per square foot. 2106 W 69th St is a home located in Cook County with nearby schools including O'Toole Elementary School and The Montessori School of Englewood Charter School.
Ownership History
Date
Name
Owned For
Owner Type
Purchase Details
Closed on
Apr 1, 2023
Sold by
Burhani Management Llc
Bought by
Shibam Properties Llc
Current Estimated Value
Purchase Details
Closed on
Jul 10, 2009
Sold by
Deutsche Bank National Trust Company
Bought by
Burhani Management Llc
Purchase Details
Closed on
Apr 29, 2009
Sold by
Jones Sherman
Bought by
Deutsche Bank National Trust Company
Purchase Details
Closed on
Jan 11, 1999
Sold by
Chicago Title Land Trust Company
Bought by
Jones Sherman
Home Financials for this Owner
Home Financials are based on the most recent Mortgage that was taken out on this home.
Original Mortgage
$76,500
Interest Rate
6.89%
Purchase Details
Closed on
Jul 13, 1998
Sold by
Harris Trust & Svgs Bank
Bought by
The Chicago Trust Company and Trust #1102585
Purchase Details
Closed on
Mar 19, 1998
Sold by
Gates Mary J
Bought by
Harris Trust & Svgs Bank and Home Equity Loan Trust 1996-3
Create a Home Valuation Report for This Property
The Home Valuation Report is an in-depth analysis detailing your home's value as well as a comparison with similar homes in the area
Home Values in the Area
Average Home Value in this Area
Purchase History
| Date | Buyer | Sale Price | Title Company |
|---|---|---|---|
| Shibam Properties Llc | -- | None Listed On Document | |
| Burhani Management Llc | $17,500 | Cti | |
| Deutsche Bank National Trust Company | -- | None Available | |
| Jones Sherman | $73,000 | -- | |
| The Chicago Trust Company | $36,000 | Professional National Title | |
| Harris Trust & Svgs Bank | -- | Professional National Title |
Source: Public Records
Mortgage History
| Date | Status | Borrower | Loan Amount |
|---|---|---|---|
| Previous Owner | Jones Sherman | $76,500 |
Source: Public Records
Tax History
| Year | Tax Paid | Tax Assessment Tax Assessment Total Assessment is a certain percentage of the fair market value that is determined by local assessors to be the total taxable value of land and additions on the property. | Land | Improvement |
|---|---|---|---|---|
| 2025 | $1,055 | $9,000 | $930 | $8,070 |
| 2024 | $1,055 | $9,000 | $930 | $8,070 |
| 2023 | $1,028 | $5,000 | $2,015 | $2,985 |
| 2022 | $1,028 | $5,000 | $2,015 | $2,985 |
| 2021 | $1,005 | $5,000 | $2,015 | $2,985 |
| 2020 | $1,315 | $5,902 | $2,015 | $3,887 |
| 2019 | $1,318 | $6,558 | $2,015 | $4,543 |
| 2018 | $1,295 | $6,558 | $2,015 | $4,543 |
| 2017 | $1,808 | $8,397 | $1,860 | $6,537 |
| 2016 | $1,682 | $8,397 | $1,860 | $6,537 |
| 2015 | $1,539 | $8,397 | $1,860 | $6,537 |
| 2014 | $1,510 | $8,138 | $1,705 | $6,433 |
| 2013 | $1,480 | $8,138 | $1,705 | $6,433 |
Source: Public Records
Map
Nearby Homes
- 2115 W 68th Place
- 2101 W 69th St
- 6831 S Winchester Ave
- 6755 S Bell Ave
- 2107 W 70th Place
- 6823 S Wolcott Ave
- 6716 S Bell Ave
- 6826 S Honore St
- 6824 S Honore St
- 2133 W 71st St
- 6722 S Oakley Ave
- 6933 S Honore St
- 7130 S Seeley Ave
- 6642 S Wolcott Ave
- 7028 S Honore St
- 6818 S Wood St
- 6715 S Claremont Ave
- 7144 S Seeley Ave
- 7142 S Damen Ave
- 6721 S Honore St
- 2102 W 69th St
- 2108 W 69th St
- 2100 W 69th St
- 2112 W 69th St
- 2114 W 69th St
- 2114 W 69th St
- 2118 W 69th St
- 2058 W 69th St
- 2107 W 68th Place
- 2109 W 68th Place
- 2111 W 68th Place
- 2122 W 69th St
- 2054 W 69th St
- 2103 W 68th Place
- 2103 W 68th Place
- 2117 W 68th Place
- 2124 W 69th St
- 2101 W 69th Place
- 2101 W 69th Place
- 2119 W 68th Place
Your Personal Tour Guide
Ask me questions while you tour the home.