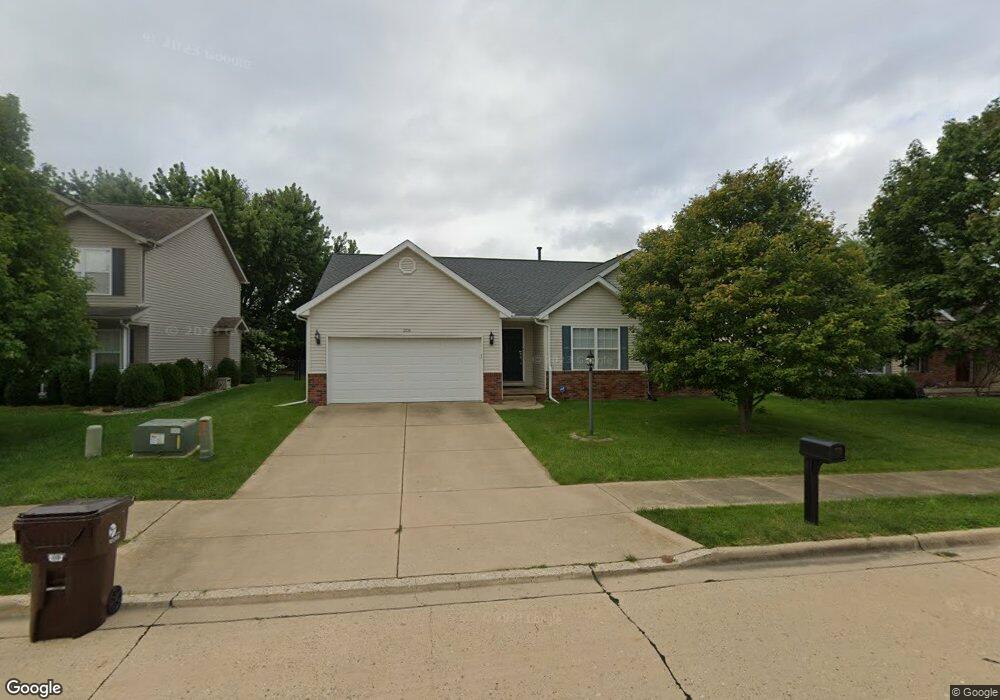
2106 W Miners Dr Dunlap, IL 61525
North Peoria NeighborhoodEstimated Value: $287,000 - $368,000
4
Beds
2
Baths
1,584
Sq Ft
$198/Sq Ft
Est. Value
About This Home
This home is located at 2106 W Miners Dr, Dunlap, IL 61525 and is currently estimated at $313,496, approximately $197 per square foot. 2106 W Miners Dr is a home located in Peoria County with nearby schools including Hickory Grove Elementary School, Dunlap Middle School, and Dunlap High School.
Ownership History
Date
Name
Owned For
Owner Type
Purchase Details
Closed on
Mar 26, 2015
Sold by
Oconnor Homes & Realty Llc
Bought by
Yong Kim S
Current Estimated Value
Create a Home Valuation Report for This Property
The Home Valuation Report is an in-depth analysis detailing your home's value as well as a comparison with similar homes in the area
Home Values in the Area
Average Home Value in this Area
Purchase History
| Date | Buyer | Sale Price | Title Company |
|---|---|---|---|
| Yong Kim S | -- | Atg |
Source: Public Records
Tax History Compared to Growth
Tax History
| Year | Tax Paid | Tax Assessment Tax Assessment Total Assessment is a certain percentage of the fair market value that is determined by local assessors to be the total taxable value of land and additions on the property. | Land | Improvement |
|---|---|---|---|---|
| 2024 | $6,316 | $74,450 | $13,190 | $61,260 |
| 2023 | $6,054 | $70,900 | $12,560 | $58,340 |
| 2022 | $5,627 | $65,210 | $11,970 | $53,240 |
| 2021 | $5,431 | $62,100 | $11,400 | $50,700 |
| 2020 | $5,411 | $61,490 | $11,290 | $50,200 |
| 2019 | $6,250 | $71,300 | $11,290 | $60,010 |
| 2018 | $6,443 | $74,440 | $11,280 | $63,160 |
| 2017 | $6,667 | $76,740 | $11,630 | $65,110 |
| 2016 | $6,540 | $76,740 | $11,630 | $65,110 |
| 2015 | $6,123 | $74,500 | $11,290 | $63,210 |
| 2014 | $6,063 | $73,600 | $11,150 | $62,450 |
| 2013 | -- | $72,870 | $11,040 | $61,830 |
Source: Public Records
Map
Nearby Homes
- 11103 N Northfield Ln
- 2407 W Miners Dr
- 2515 W Sesame St
- 2609 W Arden Way
- 2629 W Sesame St
- 11217 N Oakwood Dr Unit 33
- 2218 W Augusta Dr
- 2233 W Augusta Dr
- 2203 W Augusta Dr
- 1205 W Poplar Woods Ct
- 2247 W Augusta Dr
- 1318 W Featherwood Dr
- 1315 W Wexford Place
- 11310 N Copper Creek Point
- 2619 W Sunset Ct
- 0 W Alta Rd
- 2010 W Alta Rd
- 2213 W Earl Ct
- 3015 W Pilgrims Way
- 11227 N Stone Creek Dr
- 2110 W Miners Dr
- 2102 W Miners Dr
- 2107 W Miners Dr
- 2116 W Miners Dr
- 2024 W Miners Dr
- 2101 W Miners Dr
- 2111 W Miners Dr
- 2029 W Murphy Dr
- 2025 W Miners Dr
- 2120 W Miners Dr
- 2115 W Miners Dr
- 2111 W Murphy Dr
- 2020 W Miners Dr
- 2105 W Murphy Dr
- 2025 W Murphy Dr
- 2019 W Miners Dr
- 2119 W Miners Dr
- 2117 W Murphy Dr
- 2122 W Miners Dr
- 2102 W Jubilee Ln Unit 2102