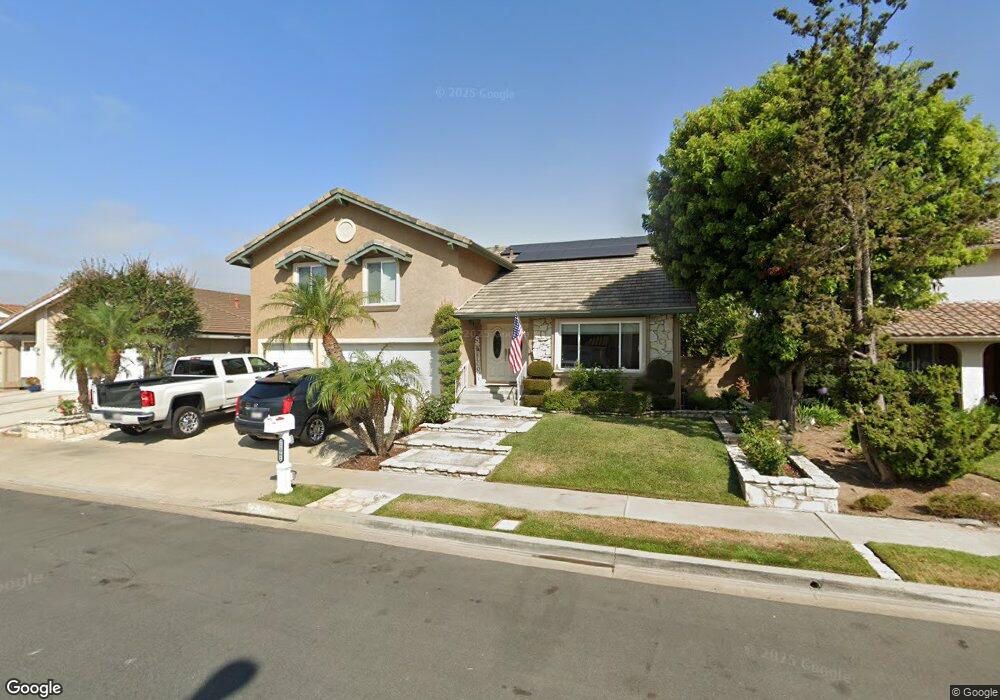
21061 Avenida Albercon Lake Forest, CA 92630
Estimated Value: $1,516,000 - $1,581,000
4
Beds
3
Baths
2,892
Sq Ft
$536/Sq Ft
Est. Value
About This Home
This home is located at 21061 Avenida Albercon, Lake Forest, CA 92630 and is currently estimated at $1,551,516, approximately $536 per square foot. 21061 Avenida Albercon is a home located in Orange County with nearby schools including Rancho Canada Elementary School, Serrano Intermediate School, and El Toro High School.
Ownership History
Date
Name
Owned For
Owner Type
Purchase Details
Closed on
Nov 21, 2019
Sold by
Stolnack Craig A and Stolnack Shelly
Bought by
Stolnack Craig A and Stolnack Shelly L
Current Estimated Value
Home Financials for this Owner
Home Financials are based on the most recent Mortgage that was taken out on this home.
Original Mortgage
$625,500
Outstanding Balance
$547,727
Interest Rate
3.37%
Mortgage Type
New Conventional
Estimated Equity
$1,003,789
Purchase Details
Closed on
Sep 14, 2015
Sold by
Stolnack Craig A and Stolnack Shelly L
Bought by
The Stolnack Family Living Trust
Purchase Details
Closed on
Mar 25, 1998
Sold by
Jensen Don B and Jensen Christine
Bought by
Stolnack Craig A and Stolnack Shelly L
Home Financials for this Owner
Home Financials are based on the most recent Mortgage that was taken out on this home.
Original Mortgage
$288,000
Interest Rate
7.06%
Create a Home Valuation Report for This Property
The Home Valuation Report is an in-depth analysis detailing your home's value as well as a comparison with similar homes in the area
Home Values in the Area
Average Home Value in this Area
Purchase History
| Date | Buyer | Sale Price | Title Company |
|---|---|---|---|
| Stolnack Craig A | -- | Accommodation | |
| Stolnack Craig A | -- | Wfg National Title Co Of Ca | |
| The Stolnack Family Living Trust | -- | None Available | |
| Stolnack Craig A | $360,000 | Fidelity National Title Ins |
Source: Public Records
Mortgage History
| Date | Status | Borrower | Loan Amount |
|---|---|---|---|
| Open | Stolnack Craig A | $625,500 | |
| Closed | Stolnack Craig A | $288,000 |
Source: Public Records
Tax History Compared to Growth
Tax History
| Year | Tax Paid | Tax Assessment Tax Assessment Total Assessment is a certain percentage of the fair market value that is determined by local assessors to be the total taxable value of land and additions on the property. | Land | Improvement |
|---|---|---|---|---|
| 2025 | $5,821 | $574,826 | $285,137 | $289,689 |
| 2024 | $5,821 | $563,555 | $279,546 | $284,009 |
| 2023 | $5,683 | $552,505 | $274,064 | $278,441 |
| 2022 | $5,580 | $541,672 | $268,690 | $272,982 |
| 2021 | $5,468 | $531,051 | $263,421 | $267,630 |
| 2020 | $5,418 | $525,606 | $260,720 | $264,886 |
| 2019 | $5,309 | $515,300 | $255,607 | $259,693 |
| 2018 | $5,208 | $505,197 | $250,596 | $254,601 |
| 2017 | $5,103 | $495,292 | $245,683 | $249,609 |
| 2016 | $5,017 | $485,581 | $240,866 | $244,715 |
| 2015 | $4,956 | $478,288 | $237,248 | $241,040 |
| 2014 | $4,847 | $468,919 | $232,600 | $236,319 |
Source: Public Records
Map
Nearby Homes
- 21231 Calle Sendero
- 25215 Avenida Pacifica Unit 44
- 25225 Avenida Tranquila Unit 102
- 21072 Paseo Verdura
- 21291 Calle Recreo
- 21301 Calle Recreo
- 25302 Vista Linda
- 25271 Baja Mar
- 17 Ponte
- 21324 Balsam Ln
- 25272 Birch Grove Ln
- 25446 Yountville
- 25162 Chestnutwood Unit 47
- 21472 Firwood Unit 9
- 27 Alessio
- 24771 Camino Villa
- 20981 Oakville Unit 35
- 21011 Marin Unit 103
- 12 Lontano
- 647 Pelion
- 21051 Avenida Albercon
- 21032 Calle Caminata
- 21041 Avenida Albercon
- 21022 Calle Caminata
- 21042 Calle Caminata
- 21062 Avenida Albercon
- 21012 Calle Caminata
- 21052 Avenida Albercon
- 21072 Avenida Albercon
- 21031 Avenida Albercon
- 21042 Avenida Albercon
- 24962 Paseo Equestre
- 24972 Paseo Equestre
- 21006 Calle Caminata
- 24952 Paseo Equestre
- 24982 Paseo Equestre
- 21032 Avenida Albercon
- 24992 Paseo Equestre
- 21021 Avenida Albercon
- 21021 Calle Caminata