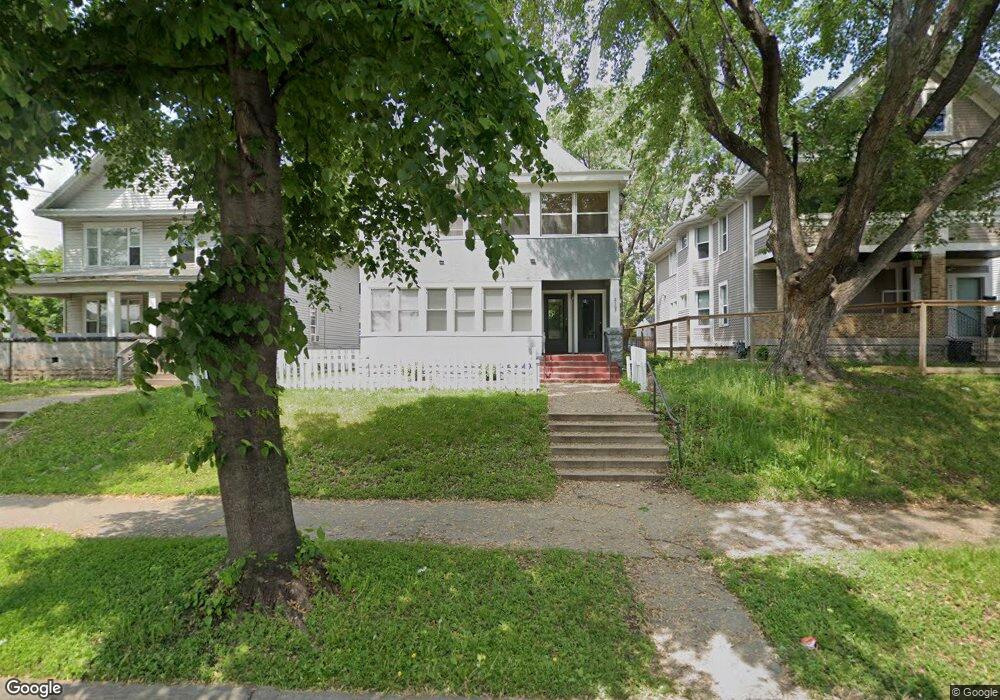
2107 N 6th St Minneapolis, MN 55411
Hawthorne NeighborhoodEstimated Value: $354,000 - $392,350
6
Beds
2
Baths
3,012
Sq Ft
$124/Sq Ft
Est. Value
About This Home
This home is located at 2107 N 6th St, Minneapolis, MN 55411 and is currently estimated at $373,838, approximately $124 per square foot. 2107 N 6th St is a home located in Hennepin County with nearby schools including Nellie Stone Johnson Elementary School, Anwatin Middle School, and North High School.
Ownership History
Date
Name
Owned For
Owner Type
Purchase Details
Closed on
Dec 1, 2020
Sold by
Canfield Jamie M and Canfield Talitha
Bought by
Hutcheson Meagan and Stevson Charity
Current Estimated Value
Home Financials for this Owner
Home Financials are based on the most recent Mortgage that was taken out on this home.
Original Mortgage
$312,240
Outstanding Balance
$277,987
Interest Rate
2.7%
Mortgage Type
FHA
Estimated Equity
$95,851
Purchase Details
Closed on
Feb 23, 2018
Sold by
Homes Pride Inc
Bought by
Cenfield Jamie A
Home Financials for this Owner
Home Financials are based on the most recent Mortgage that was taken out on this home.
Original Mortgage
$278,364
Interest Rate
3.75%
Mortgage Type
FHA
Purchase Details
Closed on
Dec 1, 2016
Sold by
Wells Fargo Bank Na
Bought by
Home Pride Inc
Purchase Details
Closed on
May 18, 2006
Sold by
Vang Chao
Bought by
Davis Benjamin L and Davis Justin J
Purchase Details
Closed on
Feb 13, 1997
Sold by
Hud
Bought by
Vang Xay and Xiong Lee
Create a Home Valuation Report for This Property
The Home Valuation Report is an in-depth analysis detailing your home's value as well as a comparison with similar homes in the area
Home Values in the Area
Average Home Value in this Area
Purchase History
| Date | Buyer | Sale Price | Title Company |
|---|---|---|---|
| Hutcheson Meagan | $318,000 | Edgewater Title Group Llc | |
| Cenfield Jamie A | $283,500 | The Title Group Inc | |
| Home Pride Inc | $57,500 | Bay Natl Title Co | |
| Davis Benjamin L | $242,000 | -- | |
| Vang Xay | $43,101 | -- | |
| Hutcheson Meagan Meagan | $318,000 | -- |
Source: Public Records
Mortgage History
| Date | Status | Borrower | Loan Amount |
|---|---|---|---|
| Open | Hutcheson Meagan | $312,240 | |
| Previous Owner | Cenfield Jamie A | $278,364 | |
| Closed | Hutcheson Meagan Meagan | $312,240 |
Source: Public Records
Tax History Compared to Growth
Tax History
| Year | Tax Paid | Tax Assessment Tax Assessment Total Assessment is a certain percentage of the fair market value that is determined by local assessors to be the total taxable value of land and additions on the property. | Land | Improvement |
|---|---|---|---|---|
| 2024 | $6,177 | $423,000 | $17,000 | $406,000 |
| 2023 | $5,136 | $395,000 | $15,000 | $380,000 |
| 2022 | $4,839 | $377,000 | $15,000 | $362,000 |
| 2021 | $4,007 | $354,000 | $13,000 | $341,000 |
| 2020 | $3,906 | $308,000 | $12,900 | $295,100 |
| 2019 | $3,077 | $280,000 | $8,600 | $271,400 |
| 2018 | $2,613 | $169,500 | $8,600 | $160,900 |
| 2017 | $5,563 | $137,000 | $7,800 | $129,200 |
| 2016 | $6,365 | $144,000 | $7,800 | $136,200 |
| 2015 | $2,676 | $120,000 | $7,800 | $112,200 |
| 2014 | -- | $114,500 | $9,000 | $105,500 |
Source: Public Records
Map
Nearby Homes
- 1900 5th St N
- 2410 Lyndale Ave N
- 2407 N 4th St
- 1814 New York Ave N
- 2214 Dupont Ave N
- 2314 Dupont Ave N
- 2527 #2 N 4th St
- 2124 Fremont Ave N
- 2323 Emerson Ave N
- 1105 25th Ave N
- 2217 Fremont Ave N
- 2634 Colfax Ave N
- 2718 N 4th St
- 2704 Bryant Ave N
- 2806 Aldrich Ave N
- 2800 Bryant Ave N
- 2504 Humboldt Ave N
- 1407 Dupont Ave N
- 2906 Bryant Ave N
- 2905 Bryant Ave N
- 2111 N 6th St
- 2101 N 6th St
- 2101 N 6th St
- 2119 N 6th St
- 2106 Lyndale Ave N
- 2123 N 6th St
- 2102 Lyndale Ave N
- 2110 Lyndale Ave N
- 2114 Lyndale Ave N
- 2110 N 6th St
- 2118 Lyndale Ave N
- 2125 N 6th St
- 2104 N 6th St
- 2114 N 6th St
- 2122 Lyndale Ave N
- 2122 N 6th St
- 2131 N 6th St
- 2126 N 6th St
- 416 21st Ave N
- 2126 Lyndale Ave N