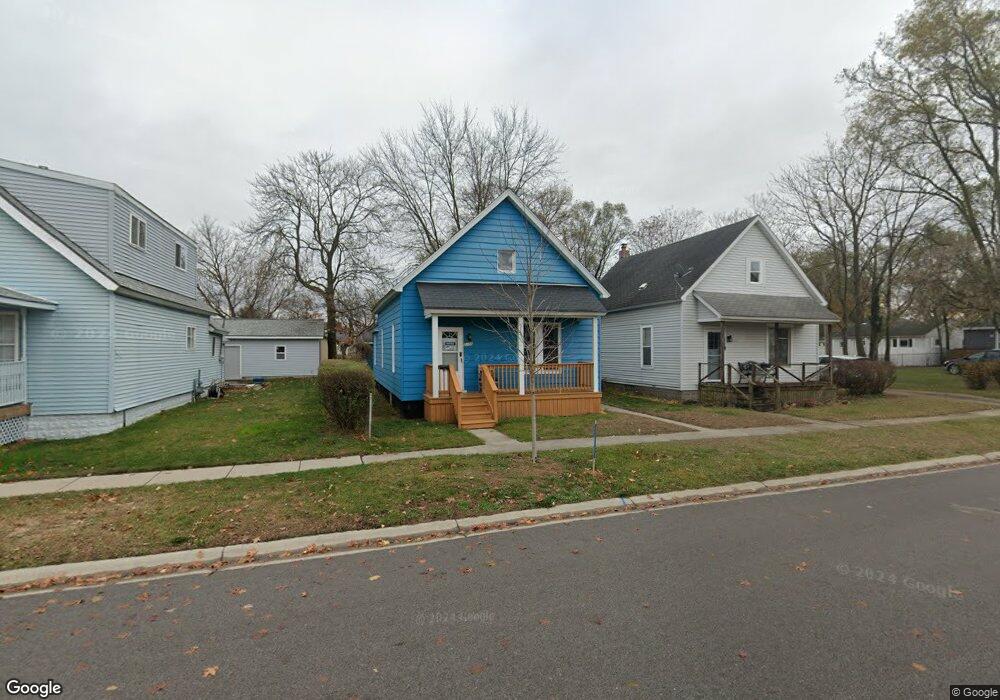
2108 11th St Port Huron, MI 48060
Estimated Value: $111,000 - $133,458
2
Beds
1
Bath
976
Sq Ft
$125/Sq Ft
Est. Value
About This Home
This home is located at 2108 11th St, Port Huron, MI 48060 and is currently estimated at $121,865, approximately $124 per square foot. 2108 11th St is a home located in St. Clair County with nearby schools including Woodrow Wilson Elementary School, Central Middle School, and Port Huron High School.
Ownership History
Date
Name
Owned For
Owner Type
Purchase Details
Closed on
May 17, 2017
Sold by
Johnson Timothy P
Bought by
Johnson Timothy P and Young James S
Current Estimated Value
Purchase Details
Closed on
Nov 10, 2008
Sold by
Johnson Timothy
Bought by
Johnson Timothy
Purchase Details
Closed on
Mar 21, 2008
Sold by
Johnson Timothy and Johnson Harvey Edwin
Bought by
Johnson Timothy and Counterman Amanda
Purchase Details
Closed on
Dec 6, 2005
Sold by
Johnson Harvey Edwin and Johnson Lillian B
Bought by
Johnson Harvey Edwin and Johnson Timothy
Create a Home Valuation Report for This Property
The Home Valuation Report is an in-depth analysis detailing your home's value as well as a comparison with similar homes in the area
Home Values in the Area
Average Home Value in this Area
Purchase History
| Date | Buyer | Sale Price | Title Company |
|---|---|---|---|
| Johnson Timothy P | -- | None Available | |
| Johnson Timothy | -- | None Available | |
| Johnson Timothy | -- | None Available | |
| Johnson Harvey Edwin | -- | None Available |
Source: Public Records
Tax History Compared to Growth
Tax History
| Year | Tax Paid | Tax Assessment Tax Assessment Total Assessment is a certain percentage of the fair market value that is determined by local assessors to be the total taxable value of land and additions on the property. | Land | Improvement |
|---|---|---|---|---|
| 2025 | $1,388 | $55,100 | $0 | $0 |
| 2024 | $1,134 | $52,200 | $0 | $0 |
| 2023 | $1,071 | $46,500 | $0 | $0 |
| 2022 | $1,070 | $38,600 | $0 | $0 |
| 2021 | $1,016 | $35,700 | $0 | $0 |
| 2020 | $1,028 | $31,500 | $31,500 | $0 |
| 2019 | $1,010 | $22,200 | $0 | $0 |
| 2018 | $988 | $22,200 | $0 | $0 |
| 2017 | $883 | $20,800 | $0 | $0 |
| 2016 | $746 | $20,800 | $0 | $0 |
| 2015 | $774 | $20,800 | $20,800 | $0 |
| 2014 | $774 | $21,600 | $21,600 | $0 |
| 2013 | -- | $22,900 | $0 | $0 |
Source: Public Records
Map
Nearby Homes
- 1112 Minnie St
- 1831 11th St
- 1127 Minnie St
- 831 Bancroft St
- 738 Bancroft St
- 730 Jenkinson St
- 731 Bancroft St
- 823 Beard St
- 1309 Division St
- 1322 Division St
- 1325 Division St
- 1132 Griswold St
- 926 Griswold St
- 2109 Military St
- 1623 8th St
- 2444 Military St
- 000 10th St
- 1103 White St
- 1403 Catherine McAuley Dr
- 1712 7th St