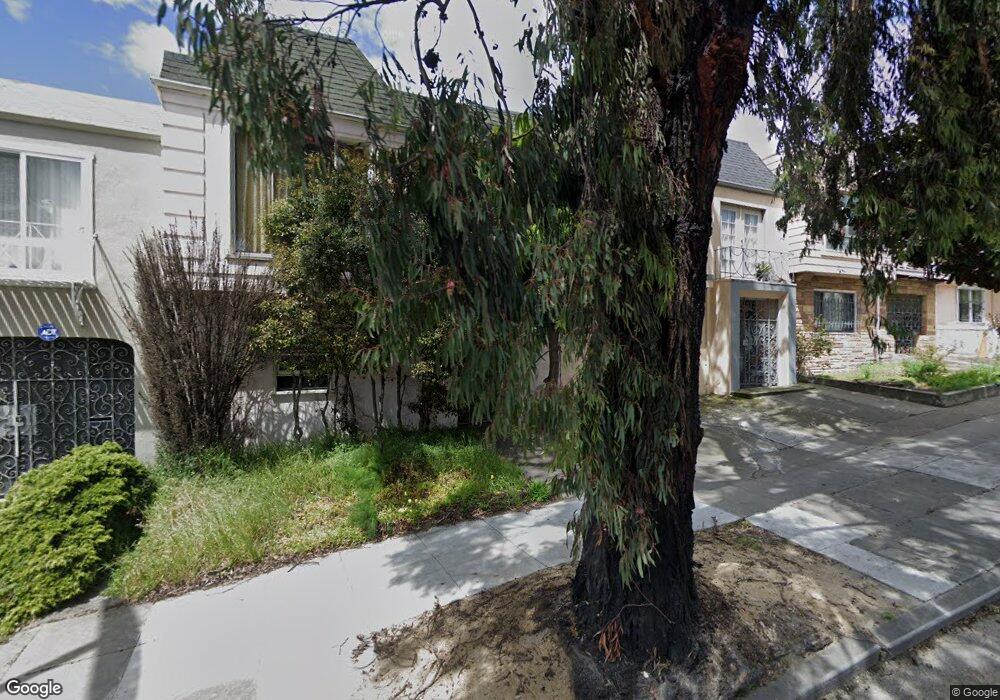
2108 Bayshore Blvd San Francisco, CA 94134
Visitacion Valley NeighborhoodEstimated Value: $954,000 - $1,073,000
2
Beds
2
Baths
1,225
Sq Ft
$837/Sq Ft
Est. Value
About This Home
This home is located at 2108 Bayshore Blvd, San Francisco, CA 94134 and is currently estimated at $1,025,464, approximately $837 per square foot. 2108 Bayshore Blvd is a home located in San Francisco County with nearby schools including El Dorado Elementary School, Visitacion Valley Middle School, and KIPP Bayview Academy.
Ownership History
Date
Name
Owned For
Owner Type
Purchase Details
Closed on
Mar 8, 2006
Sold by
Wu Hon Sun and Kwan Lai Ying
Bought by
Vanvu Hung and Nguyen Hong Thi
Current Estimated Value
Home Financials for this Owner
Home Financials are based on the most recent Mortgage that was taken out on this home.
Original Mortgage
$535,000
Outstanding Balance
$302,717
Interest Rate
6.19%
Mortgage Type
Fannie Mae Freddie Mac
Estimated Equity
$722,747
Purchase Details
Closed on
Sep 23, 1998
Sold by
Sophus Arthur L and Lee Arthur
Bought by
Wu Hon Sun and Kwan Lai Ying
Home Financials for this Owner
Home Financials are based on the most recent Mortgage that was taken out on this home.
Original Mortgage
$183,750
Interest Rate
6.88%
Purchase Details
Closed on
Apr 16, 1996
Sold by
Sophus Arthur L and Sophus Arthur Lee
Bought by
Sophus Arthur L
Create a Home Valuation Report for This Property
The Home Valuation Report is an in-depth analysis detailing your home's value as well as a comparison with similar homes in the area
Home Values in the Area
Average Home Value in this Area
Purchase History
| Date | Buyer | Sale Price | Title Company |
|---|---|---|---|
| Vanvu Hung | $680,000 | Fidelity National Title Co | |
| Wu Hon Sun | $245,000 | First American Title Co | |
| Sophus Arthur L | -- | -- |
Source: Public Records
Mortgage History
| Date | Status | Borrower | Loan Amount |
|---|---|---|---|
| Open | Vanvu Hung | $535,000 | |
| Previous Owner | Wu Hon Sun | $183,750 |
Source: Public Records
Tax History Compared to Growth
Tax History
| Year | Tax Paid | Tax Assessment Tax Assessment Total Assessment is a certain percentage of the fair market value that is determined by local assessors to be the total taxable value of land and additions on the property. | Land | Improvement |
|---|---|---|---|---|
| 2025 | $11,461 | $929,234 | $557,542 | $371,692 |
| 2024 | $11,461 | $911,014 | $546,610 | $364,404 |
| 2023 | $11,285 | $893,154 | $535,894 | $357,260 |
| 2022 | $11,063 | $875,644 | $525,388 | $350,256 |
| 2021 | $10,865 | $858,478 | $515,088 | $343,390 |
| 2020 | $10,973 | $849,678 | $509,808 | $339,870 |
| 2019 | $10,601 | $833,018 | $499,812 | $333,206 |
| 2018 | $9,582 | $760,000 | $532,000 | $228,000 |
| 2017 | $9,346 | $760,000 | $532,000 | $228,000 |
| 2016 | $9,059 | $735,000 | $441,000 | $294,000 |
| 2015 | $8,660 | $700,000 | $455,000 | $245,000 |
| 2014 | $7,303 | $590,000 | $354,000 | $236,000 |
Source: Public Records
Map
Nearby Homes
- 2104 Bay Shore Blvd Unit 16
- 2100 Bay Shore Blvd
- 2108 Bay Shore Blvd
- 2096 Bay Shore Blvd
- 2110 Bay Shore Blvd
- 2114 Bay Shore Blvd
- 2094 Bay Shore Blvd
- 2090 Bay Shore Blvd
- 2118 Bay Shore Blvd
- 33 Wabash Terrace
- 29 Wabash Terrace
- 35 Wabash Terrace
- 25 Wabash Terrace
- 2088 Bay Shore Blvd
- 39 Wabash Terrace
- 2122 Bay Shore Blvd
- 21 Wabash Terrace
- 43 Wabash Terrace
- 17 Wabash Terrace
- 2084 Bay Shore Blvd