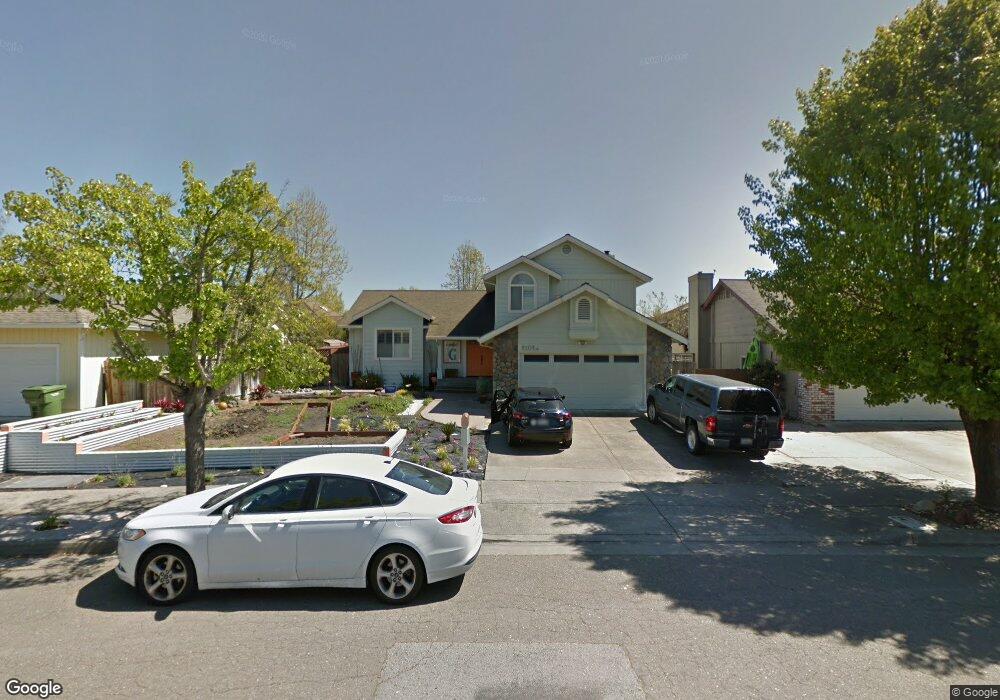
2108 Caulfield Ln Petaluma, CA 94954
Adobe NeighborhoodEstimated Value: $986,476 - $1,112,000
4
Beds
3
Baths
2,132
Sq Ft
$492/Sq Ft
Est. Value
About This Home
This home is located at 2108 Caulfield Ln, Petaluma, CA 94954 and is currently estimated at $1,048,119, approximately $491 per square foot. 2108 Caulfield Ln is a home located in Sonoma County with nearby schools including Kenilworth Junior High School, Casa Grande High School, and Miwok Valley Elementary Charter School.
Ownership History
Date
Name
Owned For
Owner Type
Purchase Details
Closed on
Jan 14, 2021
Sold by
George John F and George D
Bought by
Cappeleri Arthur R and Cappelen Rachel E
Current Estimated Value
Home Financials for this Owner
Home Financials are based on the most recent Mortgage that was taken out on this home.
Original Mortgage
$660,000
Outstanding Balance
$589,052
Interest Rate
2.71%
Mortgage Type
New Conventional
Estimated Equity
$459,067
Purchase Details
Closed on
Sep 27, 2010
Sold by
George John F and George Kim D
Bought by
George John F and George Kim D
Home Financials for this Owner
Home Financials are based on the most recent Mortgage that was taken out on this home.
Original Mortgage
$270,100
Interest Rate
4.28%
Mortgage Type
New Conventional
Purchase Details
Closed on
Nov 11, 2008
Sold by
George John F and George Kim D
Bought by
George John F and George Kim D
Purchase Details
Closed on
Mar 23, 1988
Bought by
George John F Tr & George Kim D Tr
Create a Home Valuation Report for This Property
The Home Valuation Report is an in-depth analysis detailing your home's value as well as a comparison with similar homes in the area
Home Values in the Area
Average Home Value in this Area
Purchase History
| Date | Buyer | Sale Price | Title Company |
|---|---|---|---|
| Cappeleri Arthur R | $825,000 | Fidelity National Title Co | |
| George John F | -- | Old Republic Title Company | |
| George John F | -- | Old Republic Title Company | |
| George John F | -- | None Available | |
| George John F Tr & George Kim D Tr | $173,500 | -- |
Source: Public Records
Mortgage History
| Date | Status | Borrower | Loan Amount |
|---|---|---|---|
| Open | Cappeleri Arthur R | $660,000 | |
| Previous Owner | George John F | $270,100 |
Source: Public Records
Tax History Compared to Growth
Tax History
| Year | Tax Paid | Tax Assessment Tax Assessment Total Assessment is a certain percentage of the fair market value that is determined by local assessors to be the total taxable value of land and additions on the property. | Land | Improvement |
|---|---|---|---|---|
| 2025 | $9,791 | $893,003 | $357,201 | $535,802 |
| 2024 | $9,791 | $875,495 | $350,198 | $525,297 |
| 2023 | $9,791 | $858,330 | $343,332 | $514,998 |
| 2022 | $9,565 | $841,500 | $336,600 | $504,900 |
| 2021 | $3,498 | $305,900 | $106,088 | $199,812 |
| 2020 | $3,521 | $302,765 | $105,001 | $197,764 |
| 2019 | $3,483 | $296,830 | $102,943 | $193,887 |
| 2018 | $3,382 | $291,011 | $100,925 | $190,086 |
| 2017 | $3,332 | $285,306 | $98,947 | $186,359 |
| 2016 | $3,187 | $279,712 | $97,007 | $182,705 |
| 2015 | $3,104 | $275,511 | $95,550 | $179,961 |
| 2014 | $3,072 | $270,115 | $93,679 | $176,436 |
Source: Public Records
Map
Nearby Homes
- 724 Garfield Dr
- 1103 Marylyn Cir
- 2189 Saint Augustine Cir
- 601 Marylyn Cir Unit 21
- 602 Marylyn Cir
- 642 Albert Way
- 29 Palomino Ct
- 1711 Capistrano Dr
- 2053 Vista Ln
- 2044 Willow Dr
- 2013 Knight Ave
- 1627 Juliet Dr
- 1785 Pine Ave
- 1688 Kearny Ct
- 1513 Elizabeth Dr
- 73 Alta Dr
- 1705 Clairmont Ct
- 2 Wedgewood Ct
- 12 Birnam Wood Ct
- 112 Rose Petal Ct
- 2106 Caulfield Ln
- 2112 Caulfield Ln
- 2111 Saint Augustine Cir
- 2115 Saint Augustine Cir
- 2107 Saint Augustine Cir
- 2102 Caulfield Ln
- 2114 Caulfield Ln
- 2109 Caulfield Ln
- 2107 Caulfield Ln
- 2103 Saint Augustine Cir
- 2117 Saint Augustine Cir
- 2103 Caulfield Ln
- 2100 Caulfield Ln
- 2113 Caulfield Ln
- 2101 Caulfield Ln
- 2101 Saint Augustine Cir
- 2114 Saint Augustine Cir
- 1 Persimmon Ct
- 2115 Caulfield Ln
- 3 Persimmon Ct