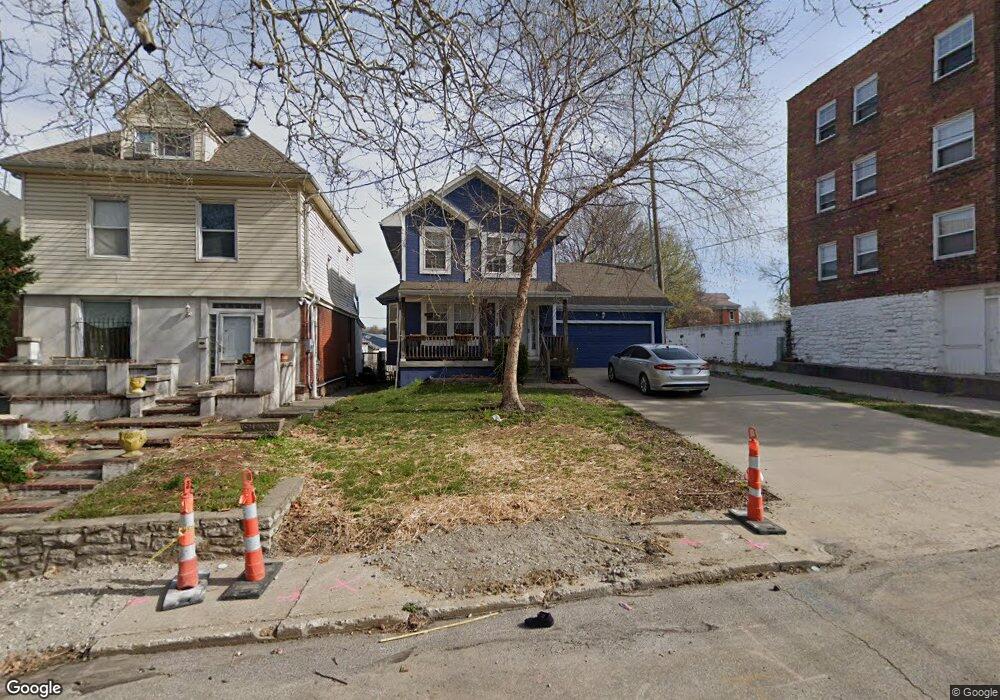
2108 E 11th St Kansas City, MO 64127
Forgotten Homes NeighborhoodEstimated Value: $170,000 - $215,000
3
Beds
3
Baths
1,424
Sq Ft
$141/Sq Ft
Est. Value
About This Home
This home is located at 2108 E 11th St, Kansas City, MO 64127 and is currently estimated at $200,136, approximately $140 per square foot. 2108 E 11th St is a home located in Jackson County with nearby schools including Wendell Phillips Elementary School, Northeast Middle School, and Northeast High School.
Ownership History
Date
Name
Owned For
Owner Type
Purchase Details
Closed on
May 6, 2020
Sold by
Aguiar Claude G
Bought by
Hilvert Robert C
Current Estimated Value
Home Financials for this Owner
Home Financials are based on the most recent Mortgage that was taken out on this home.
Original Mortgage
$127,555
Outstanding Balance
$113,031
Interest Rate
3.3%
Mortgage Type
New Conventional
Estimated Equity
$87,105
Purchase Details
Closed on
Mar 28, 2019
Sold by
Aguiar Amy R and Aguiar Claude G
Bought by
Aguiar Claude G
Purchase Details
Closed on
Jul 1, 2015
Sold by
Aguiar Claude G
Bought by
Aguiar Amy R
Purchase Details
Closed on
Mar 6, 2009
Sold by
Coles Amy R and Aguiar Amy R
Bought by
Aguiar Amy R and Aguiar Claude G
Purchase Details
Closed on
Jul 31, 2007
Sold by
Twelfth Street Heritage Development Corp
Bought by
Coles Amy R
Home Financials for this Owner
Home Financials are based on the most recent Mortgage that was taken out on this home.
Original Mortgage
$96,425
Interest Rate
6.73%
Mortgage Type
Purchase Money Mortgage
Create a Home Valuation Report for This Property
The Home Valuation Report is an in-depth analysis detailing your home's value as well as a comparison with similar homes in the area
Home Values in the Area
Average Home Value in this Area
Purchase History
| Date | Buyer | Sale Price | Title Company |
|---|---|---|---|
| Hilvert Robert C | -- | None Available | |
| Aguiar Claude G | -- | Alpha Title Guaranty Inc | |
| Aguiar Amy R | -- | None Available | |
| Aguiar Amy R | -- | None Available | |
| Coles Amy R | -- | Old Republic Title Company |
Source: Public Records
Mortgage History
| Date | Status | Borrower | Loan Amount |
|---|---|---|---|
| Open | Hilvert Robert C | $127,555 | |
| Previous Owner | Coles Amy R | $96,425 |
Source: Public Records
Tax History Compared to Growth
Tax History
| Year | Tax Paid | Tax Assessment Tax Assessment Total Assessment is a certain percentage of the fair market value that is determined by local assessors to be the total taxable value of land and additions on the property. | Land | Improvement |
|---|---|---|---|---|
| 2025 | $2,187 | $25,985 | $2,058 | $23,927 |
| 2024 | $2,166 | $27,710 | $2,652 | $25,058 |
| 2023 | $2,166 | $27,710 | $3,067 | $24,643 |
| 2022 | $1,907 | $23,180 | $2,793 | $20,387 |
| 2021 | $1,900 | $23,180 | $2,793 | $20,387 |
| 2020 | $1,832 | $22,066 | $2,793 | $19,273 |
| 2019 | $1,794 | $22,066 | $2,793 | $19,273 |
| 2018 | $1,452 | $18,243 | $1,779 | $16,464 |
| 2017 | $1,452 | $18,243 | $1,779 | $16,464 |
| 2016 | $1,424 | $17,785 | $808 | $16,977 |
| 2014 | $11 | $17,785 | $808 | $16,977 |
Source: Public Records
Map
Nearby Homes
- 1119 Garfield Ave
- 1215 Park Ave
- 1228 Olive St
- 2612 E 10th St
- 2825 E 10th St
- 2832 Peery Ave
- 2211 Amie St
- 414 & 416 Olive St
- 1316 Admiral Blvd
- 3110 E 13th St
- 325 Ord St
- 330 Wabash Ave
- 446 Montgall Ave
- 1321 Michigan Ave
- 915 Benton Blvd
- 3029 E 7th St
- 421 Prospect Ave
- 3221 E 11 St
- 412 Montgall Ave
- 1234 Indiana Ave
- 2108 E 11 St
- 2106 E 11th St
- 2102 E 11th St
- 1015 Garfield Ave
- 1019 Garfield Ave
- 1107 Garfield Ave
- 1105 Garfield Ave
- 1010 Brooklyn Ave
- 1008 Brooklyn Ave
- 1009 Garfield Ave
- 1006 Brooklyn Ave
- 1005 Garfield Ave
- 1101 Brooklyn Ave
- 1031 Brooklyn Ave
- 1004 Brooklyn Ave
- 1027 Brooklyn Ave
- 1105 Brooklyn Ave
- 1001 Garfield Ave
- 1100 Brooklyn Ave
- 1107 Brooklyn Ave