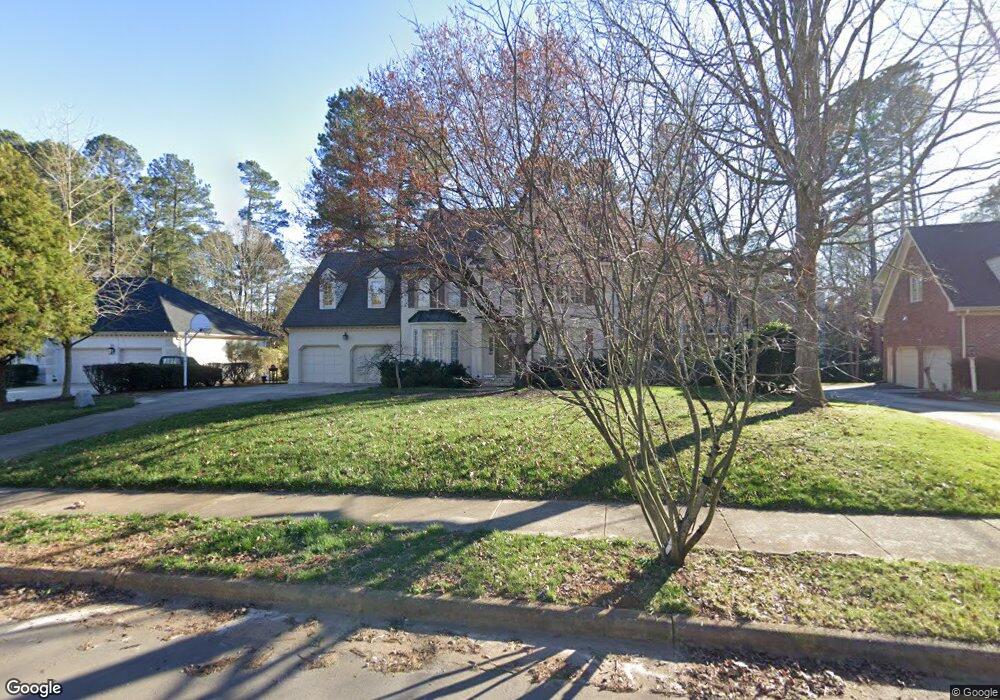
2108 Gresham Lake Rd Raleigh, NC 27615
North Ridge NeighborhoodEstimated Value: $774,000 - $1,035,000
4
Beds
3
Baths
3,377
Sq Ft
$267/Sq Ft
Est. Value
About This Home
This home is located at 2108 Gresham Lake Rd, Raleigh, NC 27615 and is currently estimated at $903,033, approximately $267 per square foot. 2108 Gresham Lake Rd is a home located in Wake County with nearby schools including North Ridge Elementary School, West Millbrook Middle School, and Millbrook High School.
Ownership History
Date
Name
Owned For
Owner Type
Purchase Details
Closed on
Apr 6, 2017
Sold by
Gelband Jason I and Gelband Jodi R
Bought by
Lipner Rachel E and Diorio Toth Nathan S
Current Estimated Value
Home Financials for this Owner
Home Financials are based on the most recent Mortgage that was taken out on this home.
Original Mortgage
$425,000
Outstanding Balance
$353,179
Interest Rate
4.16%
Mortgage Type
New Conventional
Estimated Equity
$549,854
Purchase Details
Closed on
Mar 12, 2007
Sold by
White Windall C and White Mary L
Bought by
Gelband Jason I and Gelband Jodi R
Home Financials for this Owner
Home Financials are based on the most recent Mortgage that was taken out on this home.
Original Mortgage
$395,920
Interest Rate
6.3%
Mortgage Type
Purchase Money Mortgage
Create a Home Valuation Report for This Property
The Home Valuation Report is an in-depth analysis detailing your home's value as well as a comparison with similar homes in the area
Home Values in the Area
Average Home Value in this Area
Purchase History
| Date | Buyer | Sale Price | Title Company |
|---|---|---|---|
| Lipner Rachel E | $500,000 | None Available | |
| Gelband Jason I | $495,000 | None Available |
Source: Public Records
Mortgage History
| Date | Status | Borrower | Loan Amount |
|---|---|---|---|
| Open | Lipner Rachel E | $425,000 | |
| Previous Owner | Gelband Jason I | $395,920 |
Source: Public Records
Tax History
| Year | Tax Paid | Tax Assessment Tax Assessment Total Assessment is a certain percentage of the fair market value that is determined by local assessors to be the total taxable value of land and additions on the property. | Land | Improvement |
|---|---|---|---|---|
| 2025 | $7,734 | $884,493 | $432,000 | $452,493 |
| 2024 | $7,702 | $884,493 | $432,000 | $452,493 |
Source: Public Records
Map
Nearby Homes
- 2216 Gresham Lake Rd
- 2420 Clerestory Place
- 7707 Litcham Dr
- 2408 Lemuel Dr
- 2330 Big Sky Ln
- 8209 Bellingham Cir
- 8309 Harps Mill Rd
- 7417 New Hampshire Ct
- 7804 Milltrace Run
- 8324 Bellingham Cir
- 7924 Hardwick Dr
- 2317 Florida Ct
- 7917 S Bridgewater Ct
- 1925 Hunting Ridge Rd
- 1708 Hunting Ridge Rd
- 7136 N Ridge Dr
- 2224 Effingham Cir
- 7905 Harps Mill Rd
- 1620 Hunting Ridge Rd
- 1500 Favorwood Ct
- 2112 Gresham Lake Rd
- 2104 Gresham Lake Rd
- 1913 Torrey Pines Place
- 1909 Torrey Pines Place
- 2116 Gresham Lake Rd
- 2100 Gresham Lake Rd
- 1917 Torrey Pines Place
- 1905 Torrey Pines Place
- 7901 Ridge Pointe Ln
- 2103 Gresham Lake Rd
- 2200 Gresham Lake Rd
- 2004 Gresham Lake Rd
- 2101 Gresham Lake Rd
- 2105 Gresham Lake Rd
- 1921 Torrey Pines Place
- 7905 Ridge Pointe Ln
- 2021 Gresham Lake Rd
- 7512 Rainwater Rd
- 7516 Rainwater Rd
- 1912 Torrey Pines Place
Your Personal Tour Guide
Ask me questions while you tour the home.