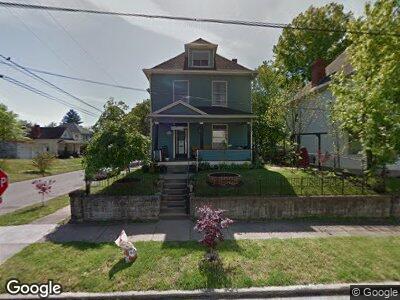
2108 Latrobe St Parkersburg, WV 26101
Estimated Value: $91,000 - $125,000
3
Beds
1
Bath
1,572
Sq Ft
$70/Sq Ft
Est. Value
About This Home
This home is located at 2108 Latrobe St, Parkersburg, WV 26101 and is currently estimated at $110,308, approximately $70 per square foot. 2108 Latrobe St is a home located in Wood County with nearby schools including Mckinley Elementary School, Van Devender Middle School, and Parkersburg High School.
Ownership History
Date
Name
Owned For
Owner Type
Purchase Details
Closed on
Nov 27, 2009
Sold by
Isemd Llc
Bought by
Cain Penny L
Current Estimated Value
Purchase Details
Closed on
Sep 15, 2009
Sold by
Mace Michael A and Mace Carol L
Bought by
Lsemd Llc
Home Financials for this Owner
Home Financials are based on the most recent Mortgage that was taken out on this home.
Original Mortgage
$31,200
Outstanding Balance
$21,243
Interest Rate
5.14%
Mortgage Type
Unknown
Purchase Details
Closed on
Jul 27, 2009
Sold by
Secretary Of Hud
Bought by
Lynn S Dodrill And Lsemd Llc
Home Financials for this Owner
Home Financials are based on the most recent Mortgage that was taken out on this home.
Original Mortgage
$31,200
Outstanding Balance
$21,243
Interest Rate
5.14%
Mortgage Type
Unknown
Purchase Details
Closed on
Oct 1, 2007
Sold by
Ever Bank
Bought by
Secretary Of Hud
Purchase Details
Closed on
Sep 27, 2007
Sold by
Martin Marian K
Bought by
Ever Bank
Create a Home Valuation Report for This Property
The Home Valuation Report is an in-depth analysis detailing your home's value as well as a comparison with similar homes in the area
Home Values in the Area
Average Home Value in this Area
Purchase History
| Date | Buyer | Sale Price | Title Company |
|---|---|---|---|
| Cain Penny L | $50,000 | None Available | |
| Lsemd Llc | $16,000 | None Available | |
| Lynn S Dodrill And Lsemd Llc | -- | None Available | |
| Secretary Of Hud | -- | None Available | |
| Ever Bank | $38,228 | None Available |
Source: Public Records
Mortgage History
| Date | Status | Borrower | Loan Amount |
|---|---|---|---|
| Open | Lsemd Llc | $31,200 | |
| Closed | Lsemd Llc | $31,200 |
Source: Public Records
Tax History Compared to Growth
Tax History
| Year | Tax Paid | Tax Assessment Tax Assessment Total Assessment is a certain percentage of the fair market value that is determined by local assessors to be the total taxable value of land and additions on the property. | Land | Improvement |
|---|---|---|---|---|
| 2024 | $975 | $62,340 | $5,940 | $56,400 |
| 2023 | $975 | $58,380 | $5,400 | $52,980 |
| 2022 | $835 | $56,460 | $5,400 | $51,060 |
| 2021 | $809 | $54,480 | $5,400 | $49,080 |
| 2020 | $782 | $52,560 | $5,400 | $47,160 |
| 2019 | $781 | $51,300 | $5,400 | $45,900 |
| 2018 | $547 | $35,100 | $5,400 | $29,700 |
| 2017 | $531 | $33,960 | $5,400 | $28,560 |
| 2016 | $505 | $34,140 | $6,540 | $27,600 |
| 2015 | $494 | $33,420 | $6,540 | $26,880 |
| 2014 | -- | $32,580 | $6,540 | $26,040 |
Source: Public Records
Map
Nearby Homes
- 1423 23rd St
- 1440 Washington Ave
- 2307 Lynn St
- 1518 Washington Ave
- 1523 20th St
- 1528 20th St
- 1714 Park St
- 1014 20th St
- 1701 Washington Ave
- 1912 Covert St
- 1630 19th St
- 2520 Clement Ave
- 1707 23rd St
- 1808 Covert St
- 1713 23rd St
- 2700 Grand Ave
- 1726 Covert St
- 1632 Lawrence St
- 1800 Washington Ave
- 1608 Lawrence St
- 2108 Latrobe St
- 2106 Latrobe St
- 1412 22nd St
- 2200 Latrobe St
- 1236 22nd St
- 1418 22nd St
- 1405 Washington Ave
- 1401 Washington Ave
- 2202 Latrobe St
- 1234 22nd St Unit 1
- 1234 22nd St
- 1411 Washington Ave
- 1411 22nd St
- 1420 22nd St
- 1237 22nd St
- 1232 22nd St
- 2204 Latrobe St
- 1413 Washington Ave
- 1315 Washington Ave
- 1415 22nd St