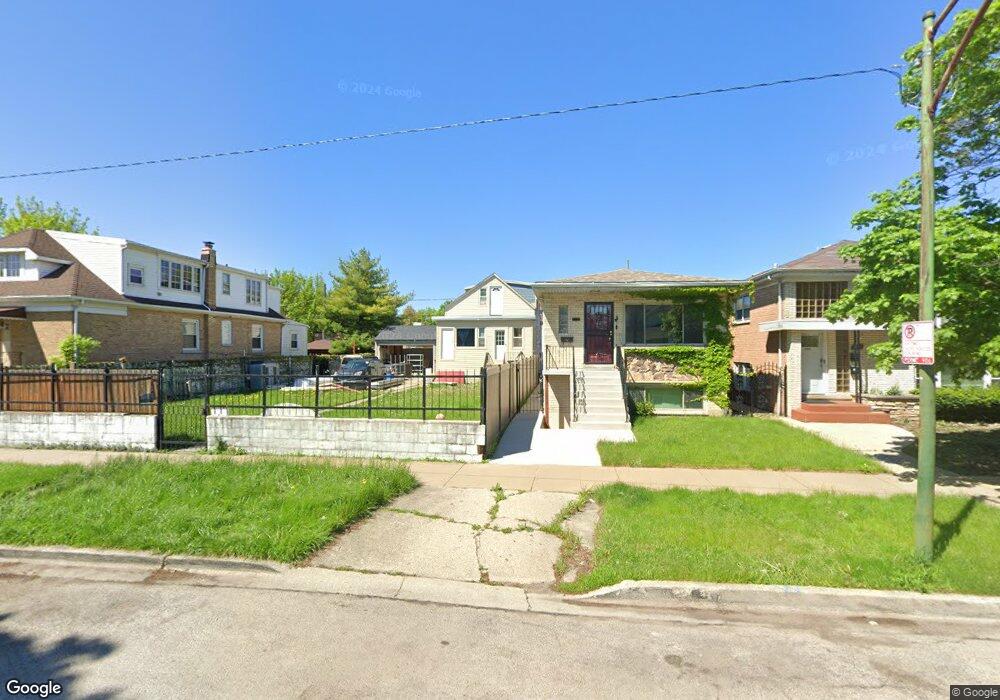
2108 N Menard Ave Chicago, IL 60639
Belmont Central NeighborhoodEstimated Value: $225,000 - $357,000
2
Beds
1
Bath
1,035
Sq Ft
$273/Sq Ft
Est. Value
About This Home
This home is located at 2108 N Menard Ave, Chicago, IL 60639 and is currently estimated at $282,547, approximately $272 per square foot. 2108 N Menard Ave is a home located in Cook County with nearby schools including Prieto Math-Science Elementary School, Steinmetz College Prep, and CICS West Belden.
Ownership History
Date
Name
Owned For
Owner Type
Purchase Details
Closed on
Mar 9, 2016
Sold by
Valencia Angela and Cabrera Luis
Bought by
Valencia Angela and Cabrera Luis A
Current Estimated Value
Purchase Details
Closed on
Sep 12, 2013
Sold by
Valencio Carmen
Bought by
Valencia Angela
Purchase Details
Closed on
Sep 25, 2007
Sold by
Reyes Miguel Angel
Bought by
Valencia Carmen
Purchase Details
Closed on
Sep 22, 2006
Sold by
Valencia Carmen and Reyes Miguel Angel
Bought by
Reyes Miguel Angel
Purchase Details
Closed on
Dec 30, 2005
Sold by
Valencia Carmen and Reyes Miguel Angel
Bought by
Valencia Carmen
Purchase Details
Closed on
Jan 26, 2001
Sold by
Villanueva Raul and Villanueva Milagros
Bought by
Valencia Carmen and Reyes Miguel Angel
Home Financials for this Owner
Home Financials are based on the most recent Mortgage that was taken out on this home.
Original Mortgage
$184,300
Interest Rate
7.18%
Create a Home Valuation Report for This Property
The Home Valuation Report is an in-depth analysis detailing your home's value as well as a comparison with similar homes in the area
Home Values in the Area
Average Home Value in this Area
Purchase History
| Date | Buyer | Sale Price | Title Company |
|---|---|---|---|
| Valencia Angela | -- | Attorney | |
| Valencia Angela | -- | None Available | |
| Valencia Carmen | -- | None Available | |
| Reyes Miguel Angel | -- | Chicago Title Insurance Comp | |
| Valencia Carmen | -- | Residential Title Services | |
| Valencia Carmen | $194,000 | -- |
Source: Public Records
Mortgage History
| Date | Status | Borrower | Loan Amount |
|---|---|---|---|
| Previous Owner | Valencia Carmen | $184,300 |
Source: Public Records
Tax History Compared to Growth
Tax History
| Year | Tax Paid | Tax Assessment Tax Assessment Total Assessment is a certain percentage of the fair market value that is determined by local assessors to be the total taxable value of land and additions on the property. | Land | Improvement |
|---|---|---|---|---|
| 2024 | $2,521 | $23,978 | $5,781 | $18,197 |
| 2023 | $2,438 | $14,926 | $4,688 | $10,238 |
| 2022 | $2,438 | $14,926 | $4,688 | $10,238 |
| 2021 | $2,400 | $14,924 | $4,687 | $10,237 |
| 2020 | $2,449 | $13,777 | $3,906 | $9,871 |
| 2019 | $2,569 | $15,867 | $3,906 | $11,961 |
| 2018 | $2,525 | $15,867 | $3,906 | $11,961 |
| 2017 | $2,599 | $15,103 | $3,437 | $11,666 |
| 2016 | $2,576 | $15,103 | $3,437 | $11,666 |
| 2015 | $2,336 | $15,103 | $3,437 | $11,666 |
| 2014 | $2,516 | $15,863 | $3,125 | $12,738 |
| 2013 | $2,456 | $15,863 | $3,125 | $12,738 |
Source: Public Records
Map
Nearby Homes
- 2241 N Monitor Ave
- 2123 N Austin Ave
- 2119 N Mcvicker Ave
- 2314 N Mango Ave
- 1805 N Mason Ave
- 2341 N Major Ave
- 1742 N Mayfield Ave
- 1720 N Major Ave
- 2419 N Central Ave
- 2430 N Central Ave
- 1831 N Linder Ave
- 1922 N Lotus Ave
- 1657 N Austin Ave
- 1925 N Lotus Ave
- 1921 N Lotus Ave
- 2103 N Long Ave
- 1715 N Meade Ave
- 5402 W Hanson Ave
- 1705 N Central Ave
- 1920 N Long Ave
- 2106 N Menard Ave
- 2110 N Menard Ave
- 2114 N Menard Ave
- 2102 N Menard Ave
- 2116 N Menard Ave
- 2116 N Menard Ave Unit Z
- 2109 N Monitor Ave
- 2109 N Monitor Ave Unit 11
- 2120 N Menard Ave Unit 2
- 2120 N Menard Ave
- 2107 N Monitor Ave
- 2111 N Monitor Ave
- 2124 N Menard Ave
- 2115 N Monitor Ave
- 2101 N Monitor Ave
- 2119 N Monitor Ave
- 2119 N Monitor Ave
- 2126 N Menard Ave
- 2126 N Menard Ave