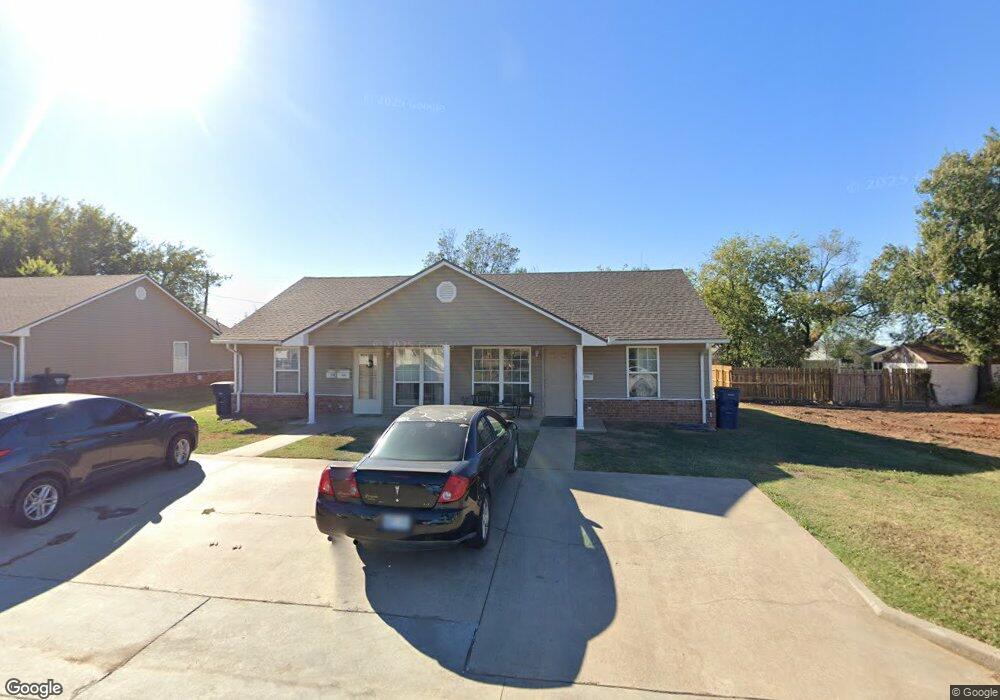
2108 N Pottenger Ave Shawnee, OK 74804
Estimated Value: $127,000 - $197,210
2
Beds
1
Bath
1,656
Sq Ft
$101/Sq Ft
Est. Value
About This Home
This home is located at 2108 N Pottenger Ave, Shawnee, OK 74804 and is currently estimated at $167,303, approximately $101 per square foot. 2108 N Pottenger Ave is a home located in Pottawatomie County with nearby schools including Jefferson Elementary School, Shawnee Middle School, and Shawnee High School.
Ownership History
Date
Name
Owned For
Owner Type
Purchase Details
Closed on
Jan 20, 2016
Sold by
Self Chad H and Self Kimberly
Bought by
Ck & K Properties Llc
Current Estimated Value
Home Financials for this Owner
Home Financials are based on the most recent Mortgage that was taken out on this home.
Original Mortgage
$96,000
Interest Rate
3.56%
Mortgage Type
Purchase Money Mortgage
Purchase Details
Closed on
Jan 2, 2007
Sold by
Self Chad H and Self Kimberly
Bought by
Self Chad H and Self Kimberly
Purchase Details
Closed on
Jun 2, 1997
Sold by
Brown Greg and Brown Christine
Bought by
Owen Thomas and Owen Jacqueline
Purchase Details
Closed on
Jun 17, 1996
Sold by
Board Of County Comm
Bought by
Brown Greg
Purchase Details
Closed on
Jun 13, 1994
Sold by
Cullison Janell
Bought by
Day Buck
Create a Home Valuation Report for This Property
The Home Valuation Report is an in-depth analysis detailing your home's value as well as a comparison with similar homes in the area
Home Values in the Area
Average Home Value in this Area
Purchase History
| Date | Buyer | Sale Price | Title Company |
|---|---|---|---|
| Ck & K Properties Llc | -- | Attorney | |
| Ck & K Properties Llc | -- | Attorney | |
| Self Chad H | -- | None Available | |
| Owen Thomas | -- | -- | |
| Brown Greg | -- | -- | |
| Day Buck | -- | -- |
Source: Public Records
Mortgage History
| Date | Status | Borrower | Loan Amount |
|---|---|---|---|
| Previous Owner | Ck & K Properties Llc | $96,000 | |
| Closed | Ck & K Properties Llc | $0 |
Source: Public Records
Tax History Compared to Growth
Tax History
| Year | Tax Paid | Tax Assessment Tax Assessment Total Assessment is a certain percentage of the fair market value that is determined by local assessors to be the total taxable value of land and additions on the property. | Land | Improvement |
|---|---|---|---|---|
| 2024 | $2,343 | $22,934 | $1,170 | $21,764 |
| 2023 | $2,343 | $22,426 | $1,143 | $21,283 |
| 2022 | $2,191 | $21,358 | $1,085 | $20,273 |
| 2021 | $2,050 | $21,358 | $1,085 | $20,273 |
| 2020 | $1,957 | $19,372 | $978 | $18,394 |
| 2019 | $1,926 | $18,449 | $921 | $17,528 |
| 2018 | $1,798 | $17,572 | $890 | $16,682 |
| 2017 | $1,689 | $16,735 | $1,440 | $15,295 |
| 2016 | $1,626 | $15,938 | $1,440 | $14,498 |
| 2015 | $1,518 | $15,179 | $1,440 | $13,739 |
| 2014 | $1,446 | $14,456 | $1,440 | $13,016 |
Source: Public Records
Map
Nearby Homes
- 2106 N Aydelotte Ave
- 202 W Franklin St
- 1925 N Park Ave
- 216 W Georgia St
- 1834 N Market Ave
- 1710 N Park Ave
- 10 W Midland St
- 2021 N Broadway Ave
- 1817 N Bell Ave
- 9 E Chicago St
- 1901 N Bell Ave
- 1607 N Beard Ave
- 1816 N Bell Ave
- 1324 N Park Ave
- 1822 N Philadelphia Ave
- 210 E Cammack
- 1510 N Union Ave
- 1217 N Market Ave
- 2415 N Minnesota Cir
- 1012 N Chapman Ave
- 2104 N Pottenger Ave
- 809 W Franklin St
- 801 W Franklin St
- 811 W Franklin St
- 2115 N Dorothy Ave
- 2109 N Dorothy Ave
- 2102 N Pottenger Ave
- 2109 N Pottenger Ave
- 2103 N Dorothy Ave
- 725 W Franklin St
- 815 W Franklin St
- 2101 N Dorothy Ave
- 2105 N Pottenger Ave
- 721 W Franklin St
- 2020 N Pottenger Ave
- 804 W Franklin St
- 802 W Franklin St
- 806 W Franklin St
- 2013 N Dorothy Ave
- 724 W Franklin St