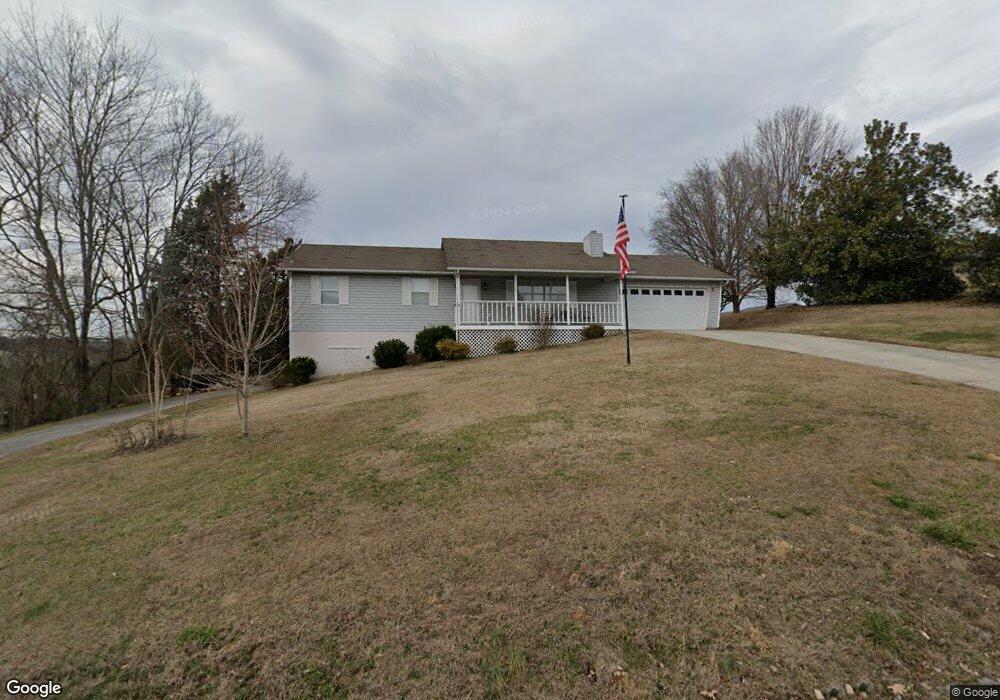
2108 Red Bank Cir Sevierville, TN 37876
Estimated Value: $281,000 - $328,876
--
Bed
2
Baths
1,344
Sq Ft
$227/Sq Ft
Est. Value
About This Home
This home is located at 2108 Red Bank Cir, Sevierville, TN 37876 and is currently estimated at $304,938, approximately $226 per square foot. 2108 Red Bank Cir is a home located in Sevier County with nearby schools including Catons Chapel Elementary School, Northview Elementary School, and Jones Cove Elementary School.
Ownership History
Date
Name
Owned For
Owner Type
Purchase Details
Closed on
Aug 5, 2022
Sold by
Chidester Randy M
Bought by
Chidester Randy M and Chidester Logan
Current Estimated Value
Purchase Details
Closed on
Aug 6, 2021
Sold by
Hill Debra Lambert
Bought by
Chidester Rick Alan and Chidester Randy
Home Financials for this Owner
Home Financials are based on the most recent Mortgage that was taken out on this home.
Original Mortgage
$261,000
Interest Rate
3%
Mortgage Type
New Conventional
Purchase Details
Closed on
Jun 21, 2016
Sold by
Lambert Lucy
Bought by
Faye Lambert Lucy and Hill Debra Lambert
Purchase Details
Closed on
Oct 14, 1991
Bought by
Lambert Calvin W Lucy
Purchase Details
Closed on
Oct 12, 1988
Bought by
Nichols Robert L and Nichols Linda F
Create a Home Valuation Report for This Property
The Home Valuation Report is an in-depth analysis detailing your home's value as well as a comparison with similar homes in the area
Home Values in the Area
Average Home Value in this Area
Purchase History
| Date | Buyer | Sale Price | Title Company |
|---|---|---|---|
| Chidester Randy M | -- | Tennessee Land Title | |
| Chidester Rick Alan | $275,000 | Tennessee Land Title | |
| Faye Lambert Lucy | -- | -- | |
| Lambert Lucy Faye | -- | -- | |
| Lambert Calvin W Lucy | $12,500 | -- | |
| Nichols Robert L | $22,000 | -- |
Source: Public Records
Mortgage History
| Date | Status | Borrower | Loan Amount |
|---|---|---|---|
| Previous Owner | Chidester Rick Alan | $261,000 |
Source: Public Records
Tax History Compared to Growth
Tax History
| Year | Tax Paid | Tax Assessment Tax Assessment Total Assessment is a certain percentage of the fair market value that is determined by local assessors to be the total taxable value of land and additions on the property. | Land | Improvement |
|---|---|---|---|---|
| 2025 | $633 | $42,775 | $9,300 | $33,475 |
| 2024 | $633 | $42,775 | $9,300 | $33,475 |
| 2023 | $633 | $42,775 | $0 | $0 |
| 2022 | $633 | $42,775 | $9,300 | $33,475 |
| 2021 | $633 | $42,775 | $9,300 | $33,475 |
| 2020 | $625 | $42,775 | $9,300 | $33,475 |
| 2019 | $625 | $33,600 | $9,300 | $24,300 |
| 2018 | $625 | $33,600 | $9,300 | $24,300 |
| 2017 | $517 | $33,600 | $9,300 | $24,300 |
| 2016 | $517 | $33,600 | $9,300 | $24,300 |
| 2015 | -- | $35,650 | $0 | $0 |
| 2014 | $581 | $35,656 | $0 | $0 |
Source: Public Records
Map
Nearby Homes
- 2218 Red Bank Cir
- Murrell Meadows Dr
- 2331 Webb Rd
- Lot 0036 Mountain Dr
- 2168 Summerfield Ln
- 1608 Mitchell Farm Rd
- 1508 Mountain Dr
- 2255 Spence Mountain Loop
- 2259 Spence Mountain Loop
- 2485 Red Bank Rd
- 1840 Trout Way
- 1825 Trout Way
- 1023 Boardly Hills Blvd
- 2646 Maples Branch Rd
- 2246 Green Acres Cir
- 2242 Green Acres Cir
- 2209 Rogers Place
- 2031 Murphys Chapel Dr
- Lot 30 Tradition Ln
- 2250 Murphys Chapel Dr
- 2226 Red Bank Cir
- 2105 Red Bank Cir
- 2105 Red Bank Cir
- 2212 Smelcer Ln
- 2222 Red Bank Cir
- 2101 Red Bank Cir
- 2206 Smelcer Ln
- 2273 Red Bank Rd
- 2113 Red Bank Cir
- 2229 Red Bank Rd
- 2229 Red Bank Cir
- 2120 Red Bank Cir
- 2225 Red Bank Cir
- 2214 Red Bank Cir
- 2223 Red Bank Cir
- 2255 Red Bank Rd
- 2219 Red Bank Cir
- 2281 Red Bank Rd
- 2203 Smelcer Ln
- 2213 Red Bank Cir