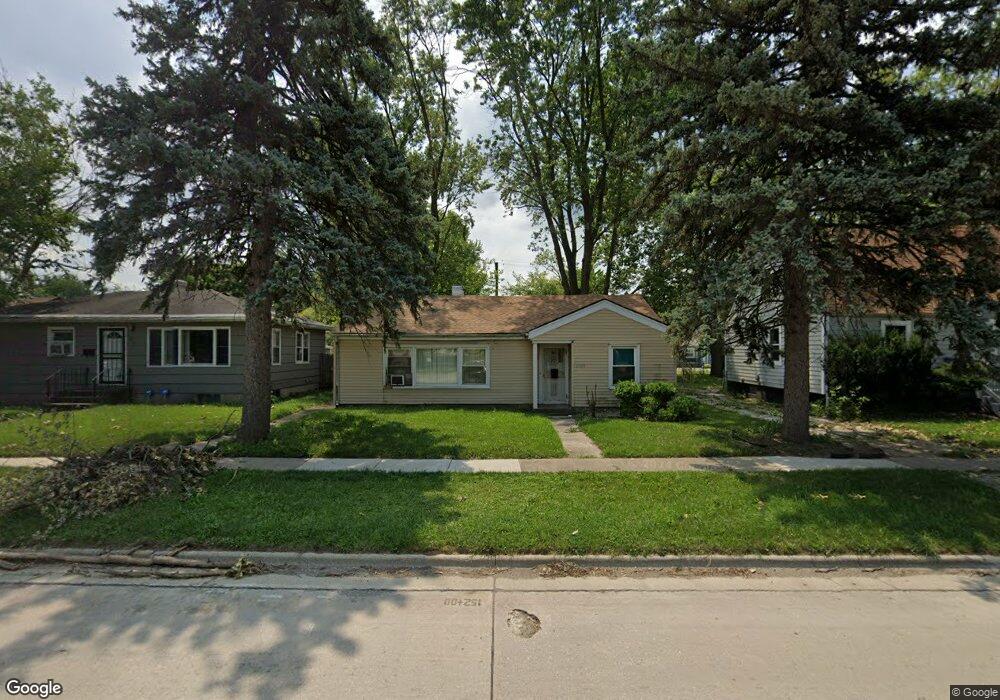
2109 167th St Hazel Crest, IL 60429
Hazel Crest Proper NeighborhoodEstimated Value: $107,527 - $185,000
3
Beds
1
Bath
1,115
Sq Ft
$136/Sq Ft
Est. Value
About This Home
This home is located at 2109 167th St, Hazel Crest, IL 60429 and is currently estimated at $151,132, approximately $135 per square foot. 2109 167th St is a home located in Cook County with nearby schools including Thornwood High School.
Ownership History
Date
Name
Owned For
Owner Type
Purchase Details
Closed on
Mar 23, 2005
Sold by
Gibbs Byron
Bought by
Brown Nacole
Current Estimated Value
Home Financials for this Owner
Home Financials are based on the most recent Mortgage that was taken out on this home.
Original Mortgage
$95,000
Outstanding Balance
$55,725
Interest Rate
8.4%
Mortgage Type
Unknown
Estimated Equity
$95,407
Purchase Details
Closed on
Feb 15, 2001
Sold by
Hud
Bought by
Gibbs Byron L
Home Financials for this Owner
Home Financials are based on the most recent Mortgage that was taken out on this home.
Original Mortgage
$44,355
Interest Rate
7.06%
Mortgage Type
FHA
Purchase Details
Closed on
Sep 8, 2000
Sold by
Chavis John
Bought by
Hud
Purchase Details
Closed on
Nov 7, 1997
Sold by
Hagerman Sandra
Bought by
Chavis John
Home Financials for this Owner
Home Financials are based on the most recent Mortgage that was taken out on this home.
Original Mortgage
$74,693
Interest Rate
7.43%
Mortgage Type
FHA
Create a Home Valuation Report for This Property
The Home Valuation Report is an in-depth analysis detailing your home's value as well as a comparison with similar homes in the area
Home Values in the Area
Average Home Value in this Area
Purchase History
| Date | Buyer | Sale Price | Title Company |
|---|---|---|---|
| Brown Nacole | -- | Stewart Title Of Illinois | |
| Gibbs Byron L | -- | -- | |
| Hud | -- | -- | |
| Chavis John | $75,000 | -- | |
| Hagerman Sandra | $61,000 | -- |
Source: Public Records
Mortgage History
| Date | Status | Borrower | Loan Amount |
|---|---|---|---|
| Open | Brown Nacole | $95,000 | |
| Previous Owner | Gibbs Byron L | $44,355 | |
| Previous Owner | Chavis John | $74,693 |
Source: Public Records
Tax History
| Year | Tax Paid | Tax Assessment Tax Assessment Total Assessment is a certain percentage of the fair market value that is determined by local assessors to be the total taxable value of land and additions on the property. | Land | Improvement |
|---|---|---|---|---|
| 2025 | $2,029 | $4,825 | $1,050 | $3,775 |
| 2024 | $2,029 | $4,825 | $1,050 | $3,775 |
| 2023 | $539 | $4,825 | $1,050 | $3,775 |
| 2022 | $539 | $2,334 | $900 | $1,434 |
| 2021 | $562 | $2,333 | $900 | $1,433 |
| 2020 | $617 | $2,333 | $900 | $1,433 |
| 2019 | $605 | $2,488 | $825 | $1,663 |
| 2018 | $586 | $2,488 | $825 | $1,663 |
| 2017 | $589 | $2,488 | $825 | $1,663 |
| 2016 | $1,002 | $2,732 | $750 | $1,982 |
| 2015 | $931 | $2,732 | $750 | $1,982 |
| 2014 | $937 | $2,732 | $750 | $1,982 |
| 2013 | $950 | $2,923 | $750 | $2,173 |
Source: Public Records
Map
Nearby Homes
- 16727 Head Ave
- 16802 Bulger Ave
- 16781 Head Ave
- 16840 Bulger Ave
- 16735 Dixie Hwy
- 16707 Dixie Hwy
- 16738 Crane Ave
- 16784 Crane Ave
- 16876 Head Ave
- 16628 Winchester Ave
- 16841 Anthony Ave
- 16784 Anthony Ave
- 16703 Lincoln St
- 16927 Crane Ave
- 16930 Winchester Ave
- 16732 Orchard Ridge Ave
- 16750 Orchard Ridge Ave
- 2030 170th St
- 2131 170th St
- 16963 Winchester Ave
- 2109 167th St
- 2105 167th St
- 2105 W 167th St
- 2113 167th St
- 2113 167th St
- 2113 W 167th St
- 2101 167th St
- 2117 167th St
- 16722 Bulger Ave
- 16725 Trapet Ave
- 16726 Bulger Ave
- 16727 Trapet Ave
- 16732 Bulger Ave
- 16733 Trapet Ave
- 16723 Bulger Ave
- 2121 167th St
- 2121 167th St
- 16743 Trapet Ave
- 16744 Bulger Ave
- 16725 Bulger Ave
Your Personal Tour Guide
Ask me questions while you tour the home.