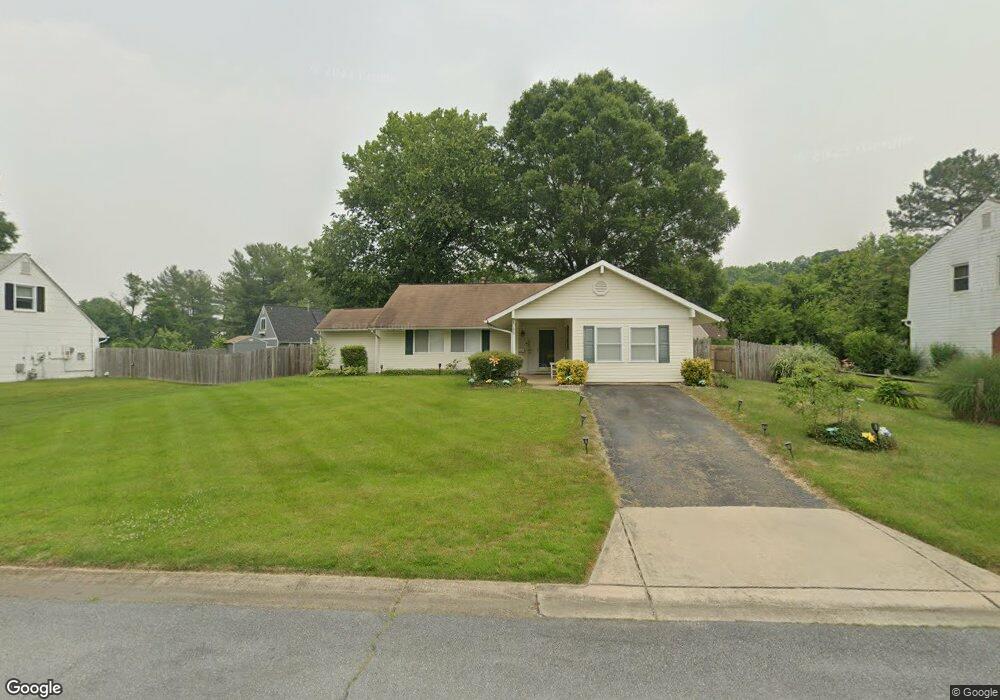
2109 Ardleigh Ct Bowie, MD 20716
Amber Meadows NeighborhoodEstimated Value: $417,000 - $502,000
4
Beds
3
Baths
1,507
Sq Ft
$307/Sq Ft
Est. Value
About This Home
This home is located at 2109 Ardleigh Ct, Bowie, MD 20716 and is currently estimated at $461,942, approximately $306 per square foot. 2109 Ardleigh Ct is a home located in Prince George's County with nearby schools including Northview Elementary School, Benjamin Tasker Middle School, and Bowie High School.
Ownership History
Date
Name
Owned For
Owner Type
Purchase Details
Closed on
Jan 13, 2010
Sold by
Underwood Christopher
Bought by
Gross Lolita M and Gross Melissa L
Current Estimated Value
Home Financials for this Owner
Home Financials are based on the most recent Mortgage that was taken out on this home.
Original Mortgage
$233,923
Interest Rate
4.85%
Mortgage Type
FHA
Purchase Details
Closed on
Dec 4, 2009
Sold by
Secretary Of Hud
Bought by
Underwood Christopher and Wiseman John
Home Financials for this Owner
Home Financials are based on the most recent Mortgage that was taken out on this home.
Original Mortgage
$233,923
Interest Rate
4.85%
Mortgage Type
FHA
Purchase Details
Closed on
Jun 1, 2009
Sold by
Rice Kenvin L
Bought by
Secretary Of Hud
Purchase Details
Closed on
Oct 7, 2003
Sold by
Koonce Clifton L
Bought by
Rice Kenvin L
Purchase Details
Closed on
Jan 17, 1996
Sold by
Greater Suburban Properties Inc
Bought by
Koonce Clifton L and Koonce Pamela A
Purchase Details
Closed on
Dec 8, 1995
Sold by
Secretary Of H U D
Bought by
Greater Suburban Properties Inc
Purchase Details
Closed on
Feb 9, 1995
Sold by
Huesman Joseph I
Bought by
Hud Housing Urban Development
Create a Home Valuation Report for This Property
The Home Valuation Report is an in-depth analysis detailing your home's value as well as a comparison with similar homes in the area
Home Values in the Area
Average Home Value in this Area
Purchase History
| Date | Buyer | Sale Price | Title Company |
|---|---|---|---|
| Gross Lolita M | $279,900 | -- | |
| Underwood Christopher | $129,162 | -- | |
| Secretary Of Hud | $252,000 | -- | |
| Rice Kenvin L | $225,000 | -- | |
| Koonce Clifton L | $135,000 | -- | |
| Greater Suburban Properties Inc | $95,300 | -- | |
| Hud Housing Urban Development | $94,000 | -- |
Source: Public Records
Mortgage History
| Date | Status | Borrower | Loan Amount |
|---|---|---|---|
| Previous Owner | Gross Lolita M | $233,923 | |
| Previous Owner | Underwood Christopher | $103,329 |
Source: Public Records
Tax History Compared to Growth
Tax History
| Year | Tax Paid | Tax Assessment Tax Assessment Total Assessment is a certain percentage of the fair market value that is determined by local assessors to be the total taxable value of land and additions on the property. | Land | Improvement |
|---|---|---|---|---|
| 2025 | $5,004 | $336,500 | $101,300 | $235,200 |
| 2024 | $5,004 | $318,233 | $0 | $0 |
| 2023 | $4,780 | $299,967 | $0 | $0 |
| 2022 | $4,512 | $281,700 | $101,300 | $180,400 |
| 2021 | $4,323 | $272,933 | $0 | $0 |
| 2020 | $4,221 | $264,167 | $0 | $0 |
| 2019 | $4,105 | $255,400 | $100,600 | $154,800 |
| 2018 | $3,954 | $242,833 | $0 | $0 |
| 2017 | $3,834 | $230,267 | $0 | $0 |
| 2016 | -- | $217,700 | $0 | $0 |
| 2015 | $3,821 | $217,700 | $0 | $0 |
| 2014 | $3,821 | $217,700 | $0 | $0 |
Source: Public Records
Map
Nearby Homes
- 16216 Audubon Ln
- 16305 Ayrwood Ln
- 16309 Ayrwood Ln
- 2312 Alstead Ln
- 16497 Fife Way
- 2118 Princess Anne Ct
- 16111 Pond Meadow Ln
- 16430 Fife Way
- 16111 Amethyst Ln
- 16380 Fife Way
- 16350 Fife Way
- 16374 Fife Way
- 15901 Perkins Ln
- 15806 Appleton Terrace
- 15718 Piller Ln
- 16115 Pointer Ridge Dr
- 1508 Pernell Ct
- 16104 Allenglen Ct
- 1313 Palmyra Ln
- 1310 Pennington Ln
- 2107 Ardleigh Ct
- 2111 Ardleigh Ct
- 16211 Alderwood Ln
- 16301 Alderwood Ln
- 16305 Alderwood Ln
- 2108 Ardleigh Ct
- 16203 Alderwood Ln
- 16307 Alderwood Ln
- 2104 Ardleigh Ct
- 2103 Ardleigh Ct
- 16208 Alderwood Ln
- 16309 Alderwood Ln
- 16206 Alderwood Ln
- 2200 Alstead Ln
- 2101 Arbor Hill Ln
- 2103 Arbor Hill Ln
- 2102 Ardleigh Ct
- 16300 Alderwood Ln
- 16302 Alderwood Ln
- 16304 Alderwood Ln