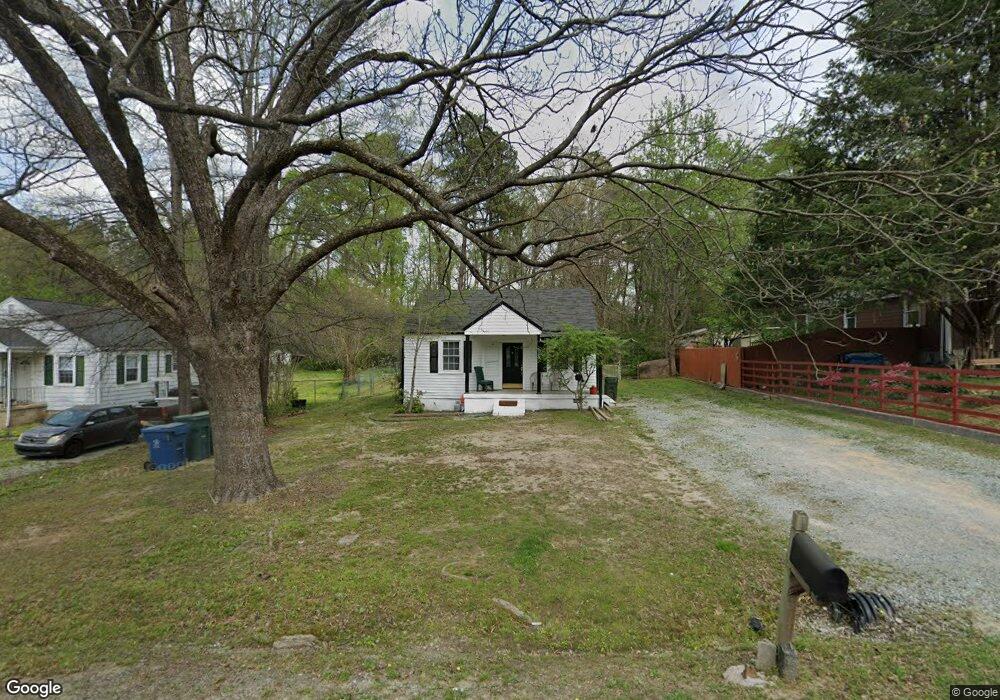
2109 Faucette Ave Durham, NC 27704
Northeast Durham NeighborhoodEstimated Value: $173,000 - $221,000
2
Beds
1
Bath
863
Sq Ft
$229/Sq Ft
Est. Value
About This Home
This home is located at 2109 Faucette Ave, Durham, NC 27704 and is currently estimated at $197,561, approximately $228 per square foot. 2109 Faucette Ave is a home located in Durham County with nearby schools including Merrick-Moore Elementary School, John W Neal Middle School, and Southern School of Energy & Sustainability.
Ownership History
Date
Name
Owned For
Owner Type
Purchase Details
Closed on
May 2, 2016
Sold by
Dawson Hilda J
Bought by
Denza Jaime Trejo and Baltazar Alejandria Lorenzo
Current Estimated Value
Purchase Details
Closed on
Nov 22, 2011
Sold by
Rattelade Eric L and Rattelade Danielle
Bought by
Dawson Hilda J
Purchase Details
Closed on
Aug 5, 2009
Sold by
Federal Home Loan Mortgage Corporation
Bought by
Rattelade Eric L
Purchase Details
Closed on
Jul 14, 2009
Sold by
Rogers Ted and Rogers Elizabeth
Bought by
Federal Home Loan Mortgage Corporation
Purchase Details
Closed on
Feb 12, 2002
Sold by
Bryant Joe L and Bryant Lydia D
Bought by
Rogers Ted and Rogers Elizabeth
Home Financials for this Owner
Home Financials are based on the most recent Mortgage that was taken out on this home.
Original Mortgage
$68,850
Interest Rate
7.12%
Create a Home Valuation Report for This Property
The Home Valuation Report is an in-depth analysis detailing your home's value as well as a comparison with similar homes in the area
Home Values in the Area
Average Home Value in this Area
Purchase History
| Date | Buyer | Sale Price | Title Company |
|---|---|---|---|
| Denza Jaime Trejo | $89,000 | -- | |
| Dawson Hilda J | $50,000 | None Available | |
| Rattelade Eric L | -- | None Available | |
| Federal Home Loan Mortgage Corporation | $40,500 | None Available | |
| Rogers Ted | $63,000 | -- |
Source: Public Records
Mortgage History
| Date | Status | Borrower | Loan Amount |
|---|---|---|---|
| Previous Owner | Rogers Ted | $68,850 |
Source: Public Records
Tax History Compared to Growth
Tax History
| Year | Tax Paid | Tax Assessment Tax Assessment Total Assessment is a certain percentage of the fair market value that is determined by local assessors to be the total taxable value of land and additions on the property. | Land | Improvement |
|---|---|---|---|---|
| 2025 | $1,588 | $200,598 | $81,875 | $118,723 |
| 2024 | $1,588 | $113,810 | $26,200 | $87,610 |
| 2023 | $1,491 | $113,810 | $26,200 | $87,610 |
| 2022 | $1,457 | $113,810 | $26,200 | $87,610 |
| 2021 | $1,450 | $113,810 | $26,200 | $87,610 |
| 2020 | $1,416 | $113,810 | $26,200 | $87,610 |
| 2019 | $1,416 | $113,810 | $26,200 | $87,610 |
| 2018 | $956 | $70,459 | $22,925 | $47,534 |
| 2017 | $949 | $70,459 | $22,925 | $47,534 |
| 2016 | $917 | $70,459 | $22,925 | $47,534 |
| 2015 | $959 | $69,245 | $25,623 | $43,622 |
| 2014 | $959 | $69,245 | $25,623 | $43,622 |
Source: Public Records
Map
Nearby Homes
- 1113 Midland Terrace
- 2321 Overland Dr
- 2015 Cheek Rd
- 5 Sue Ann Ct
- 2125 Cheek Rd
- 1823 E Geer St
- 1821 E Geer St
- 18 Syracuse Place
- 1519 Milan St
- 1515 Milan St
- 647 N Hardee St
- 1509 Logan St
- 2013 Rabbitbrush St
- 2003 Rabbitbrush St
- 2009 Rabbitbrush St
- 1115 Benning St
- 2214 Rabbitbrush St
- 2204 Rabbitbrush St
- 2206 Rabbitbrush St
- 2210 Rabbitbrush St
- 2111 Faucette Ave
- 2105 Faucette Ave
- 2115 Faucette Ave
- 2103 Faucette Ave
- 2117 Faucette Ave
- 2007 Faucette Ave
- 2108 Faucette Ave
- 2106 Faucette Ave
- 2112 Faucette Ave
- 2104 Faucette Ave
- 2118 Overland Dr
- 2008 Faucette Ave
- 2114 Faucette Ave
- 2100 Faucette Ave
- 2003 Faucette Ave
- 1101 Midland Terrace
- 1103 Midland Terrace
- 1017 Faucette Ave
- 1105 Midland Terrace
- 1015 Midland Terrace