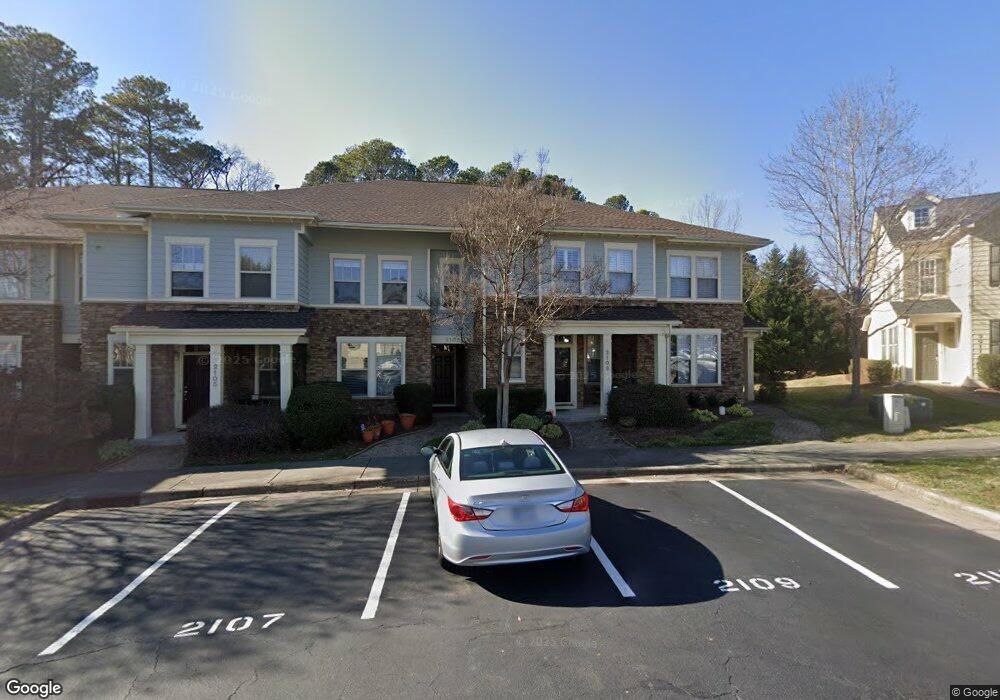
2109 Freeport Dr Cary, NC 27519
Twin Lakes NeighborhoodEstimated Value: $374,636 - $391,000
2
Beds
3
Baths
1,799
Sq Ft
$213/Sq Ft
Est. Value
About This Home
This home is located at 2109 Freeport Dr, Cary, NC 27519 and is currently estimated at $383,409, approximately $213 per square foot. 2109 Freeport Dr is a home located in Wake County with nearby schools including Cedar Fork Elementary, West Cary Middle School, and Panther Creek High School.
Ownership History
Date
Name
Owned For
Owner Type
Purchase Details
Closed on
May 26, 2017
Sold by
Sankar Sahana and Sankar Govndarajan
Bought by
Sanker Sahana
Current Estimated Value
Purchase Details
Closed on
Dec 10, 2013
Sold by
Vogler Amelia K
Bought by
Sankar Sahana and Sankar Govindarajan
Home Financials for this Owner
Home Financials are based on the most recent Mortgage that was taken out on this home.
Original Mortgage
$180,500
Outstanding Balance
$134,484
Interest Rate
4.13%
Mortgage Type
New Conventional
Estimated Equity
$248,925
Purchase Details
Closed on
May 28, 2007
Sold by
Kb Home Raleigh Durham Inc
Bought by
Vogler Amelia K
Home Financials for this Owner
Home Financials are based on the most recent Mortgage that was taken out on this home.
Original Mortgage
$167,400
Interest Rate
6.16%
Mortgage Type
Unknown
Create a Home Valuation Report for This Property
The Home Valuation Report is an in-depth analysis detailing your home's value as well as a comparison with similar homes in the area
Home Values in the Area
Average Home Value in this Area
Purchase History
| Date | Buyer | Sale Price | Title Company |
|---|---|---|---|
| Sanker Sahana | -- | None Available | |
| Sankar Sahana | $190,000 | None Available | |
| Vogler Amelia K | $209,500 | None Available |
Source: Public Records
Mortgage History
| Date | Status | Borrower | Loan Amount |
|---|---|---|---|
| Open | Sankar Sahana | $180,500 | |
| Previous Owner | Vogler Amelia K | $167,400 |
Source: Public Records
Tax History
| Year | Tax Paid | Tax Assessment Tax Assessment Total Assessment is a certain percentage of the fair market value that is determined by local assessors to be the total taxable value of land and additions on the property. | Land | Improvement |
|---|---|---|---|---|
| 2025 | $3,247 | $376,496 | $90,000 | $286,496 |
| 2024 | $3,177 | $376,496 | $90,000 | $286,496 |
Source: Public Records
Map
Nearby Homes
- 3114 Rapid Falls Rd
- 313 New Milford Rd
- 170 Point Comfort Ln
- 541 Berry Chase Way
- 726 Pierside Dr
- 716 Pierside Dr
- 509 Pemberwich Place
- 712 Pierside Dr
- 1017 Craigmeade Dr
- 103 Crescendo Dr
- 118 Linden Park Ln
- 113 Concordia Woods Dr
- 142 Brentfield Loop
- 125 Begen St
- 407 Elm Farm Place
- 308 Minton Valley Ln
- 548 Abbey Fields Loop
- 304 Clementine Dr
- 406 Clementine Dr
- 600 Courthouse Dr
- 2107 Freeport Dr
- 2105 Freeport Dr
- 2103 Freeport Dr
- 2111 Freeport Dr
- 2101 Freeport Dr
- 3011 Freeport Dr
- 2031 Freeport Dr
- 3013 Freeport Dr
- 3015 Freeport Dr
- 2029 Freeport Dr
- 3017 Freeport Dr
- 2027 Freeport Dr
- 3019 Freeport Dr
- 2025 Freeport Dr
- 3010 Freeport Dr
- 3012 Freeport Dr
- 2023 Freeport Dr
- 3021 Freeport Dr
- 3014 Freeport Dr
- 2021 Freeport Dr
Your Personal Tour Guide
Ask me questions while you tour the home.