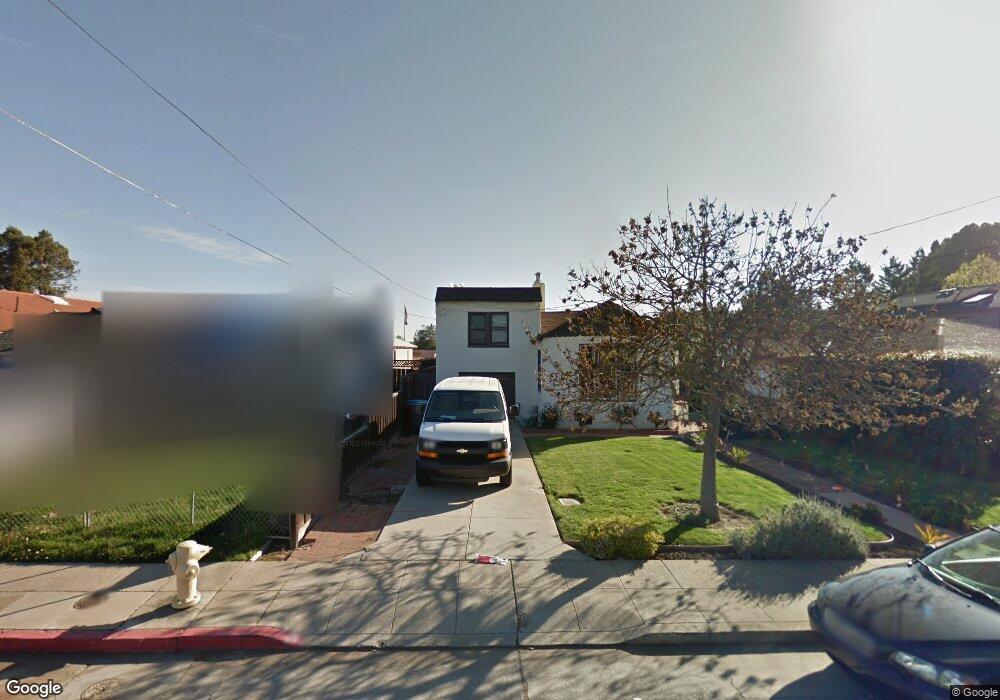
2109 Isabelle Ave San Mateo, CA 94403
Beresford Park NeighborhoodEstimated Value: $1,651,000 - $1,820,000
2
Beds
4
Baths
1,170
Sq Ft
$1,482/Sq Ft
Est. Value
About This Home
This home is located at 2109 Isabelle Ave, San Mateo, CA 94403 and is currently estimated at $1,733,895, approximately $1,481 per square foot. 2109 Isabelle Ave is a home located in San Mateo County with nearby schools including Meadow Heights Elementary School, Abbott Middle School, and Aragon High School.
Ownership History
Date
Name
Owned For
Owner Type
Purchase Details
Closed on
Dec 30, 2009
Sold by
Jung Larry H and Jung Joy N
Bought by
Jung Larry H and Jung Joy N
Current Estimated Value
Home Financials for this Owner
Home Financials are based on the most recent Mortgage that was taken out on this home.
Original Mortgage
$274,000
Interest Rate
4.78%
Mortgage Type
New Conventional
Purchase Details
Closed on
Dec 28, 2009
Sold by
Jung Larry H and Jung Joy N
Bought by
Jung Larry H and Jung Joy N
Home Financials for this Owner
Home Financials are based on the most recent Mortgage that was taken out on this home.
Original Mortgage
$274,000
Interest Rate
4.78%
Mortgage Type
New Conventional
Purchase Details
Closed on
Dec 29, 2004
Sold by
Jung Larry H and Jung Joy N
Bought by
Jung Larry H and Jung Joy N
Create a Home Valuation Report for This Property
The Home Valuation Report is an in-depth analysis detailing your home's value as well as a comparison with similar homes in the area
Home Values in the Area
Average Home Value in this Area
Purchase History
| Date | Buyer | Sale Price | Title Company |
|---|---|---|---|
| Jung Larry H | -- | None Available | |
| Jung Larry H | -- | Fidelity National Title Co | |
| Jung Larry H | -- | -- |
Source: Public Records
Mortgage History
| Date | Status | Borrower | Loan Amount |
|---|---|---|---|
| Closed | Jung Larry H | $274,000 |
Source: Public Records
Tax History Compared to Growth
Tax History
| Year | Tax Paid | Tax Assessment Tax Assessment Total Assessment is a certain percentage of the fair market value that is determined by local assessors to be the total taxable value of land and additions on the property. | Land | Improvement |
|---|---|---|---|---|
| 2025 | $8,797 | $598,894 | $241,161 | $357,733 |
| 2023 | $8,797 | $575,641 | $231,798 | $343,843 |
| 2022 | $8,742 | $564,354 | $227,253 | $337,101 |
| 2021 | $8,348 | $553,290 | $222,798 | $330,492 |
| 2020 | $7,808 | $547,618 | $220,514 | $327,104 |
| 2019 | $7,270 | $536,882 | $216,191 | $320,691 |
| 2018 | $6,828 | $526,355 | $211,952 | $314,403 |
| 2017 | $6,576 | $516,036 | $207,797 | $308,239 |
| 2016 | $6,472 | $505,919 | $203,723 | $302,196 |
| 2015 | $6,601 | $498,320 | $200,663 | $297,657 |
| 2014 | $6,443 | $488,560 | $196,733 | $291,827 |
Source: Public Records
Map
Nearby Homes
- 35 W 20th Ave Unit 113
- 35 W 20th Ave Unit 205
- 467 22nd Ave
- 472 Gymkhana Rd
- 1950 Ivy St
- 2001 Alameda de Las Pulgas Unit 174
- 1919 Alameda de Las Pulgas Unit 126
- 1919 Alameda de Las Pulgas Unit 26
- 1919 Alameda de Las Pulgas Unit 134
- 1919 Alameda de Las Pulgas Unit 80
- 1919 Alameda de Las Pulgas Unit 38
- 2615 Alameda de Las Pulgas
- 1931 Palm Ave
- 1927 Palm Ave
- 1705 Palm Ave Unit 19
- 430 27th Ave
- 30 16th Ave
- 225 28th Ave
- 112 Madison Ave Unit 108
- 35 28th Ave Unit 106B
- 2111 Isabelle Ave
- 2091 Isabelle Ave
- 2087 Isabelle Ave
- 2133 Isabelle Ave
- 2135 Isabelle Ave
- 2065 Isabelle Ave
- 2110 Isabelle Ave
- 2112 Isabelle Ave
- 2139 Isabelle Ave
- 2114 Isabelle Ave
- 2059 Isabelle Ave
- 2038 Isabelle Ave
- 2120 Isabelle Ave
- 2145 Isabelle Ave
- 2030 Isabelle Ave
- 2028 Isabelle Ave
- 317 W 20th Ave Unit W
- 325 W 20th Ave Unit W
- 2130 Isabelle Ave
- 2057 Isabelle Ave