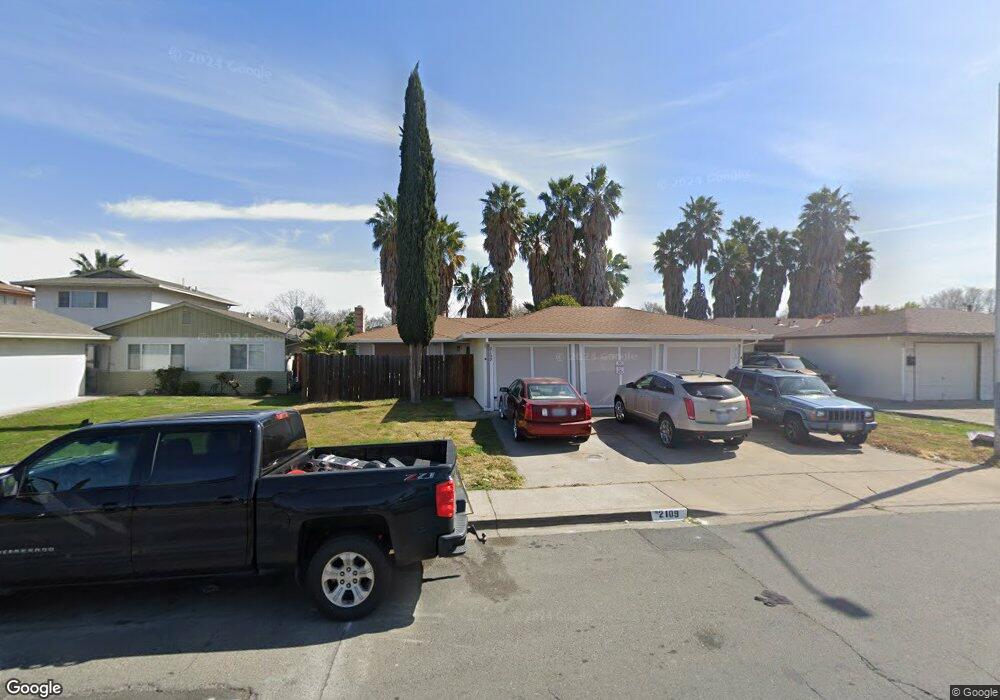
2109 Manzanita Way Unit A Antioch, CA 94509
North Antioch NeighborhoodEstimated Value: $428,000 - $665,000
2
Beds
1
Bath
850
Sq Ft
$634/Sq Ft
Est. Value
About This Home
This home is located at 2109 Manzanita Way Unit A, Antioch, CA 94509 and is currently estimated at $538,741, approximately $633 per square foot. 2109 Manzanita Way Unit A is a home located in Contra Costa County with nearby schools including Marsh Elementary School, Park Middle School, and Antioch High School.
Ownership History
Date
Name
Owned For
Owner Type
Purchase Details
Closed on
Sep 22, 2014
Sold by
Johnson Charles and Davi Frank
Bought by
Charles Johnson & Frank Davi Trust
Current Estimated Value
Purchase Details
Closed on
May 27, 2011
Sold by
Bruno Judy L
Bought by
Johnson Charles and Davi Frank
Purchase Details
Closed on
May 24, 2005
Sold by
Bruno Matthew S and Bruno Judy L
Bought by
Bruno Matthew S and Bruno Judy L
Purchase Details
Closed on
Sep 17, 1997
Sold by
Bruno Matthew S & Judy L Tre
Bought by
Bruno Matthew S and Bruno Judy L
Home Financials for this Owner
Home Financials are based on the most recent Mortgage that was taken out on this home.
Original Mortgage
$78,000
Interest Rate
8.87%
Mortgage Type
Purchase Money Mortgage
Create a Home Valuation Report for This Property
The Home Valuation Report is an in-depth analysis detailing your home's value as well as a comparison with similar homes in the area
Home Values in the Area
Average Home Value in this Area
Purchase History
| Date | Buyer | Sale Price | Title Company |
|---|---|---|---|
| Charles Johnson & Frank Davi Trust | -- | None Available | |
| Johnson Charles | $109,000 | North American Title Company | |
| Bruno Matthew S | -- | Old Republic Title | |
| Bruno Matthew S | -- | Placer Title Company |
Source: Public Records
Mortgage History
| Date | Status | Borrower | Loan Amount |
|---|---|---|---|
| Previous Owner | Bruno Matthew S | $78,000 |
Source: Public Records
Tax History Compared to Growth
Tax History
| Year | Tax Paid | Tax Assessment Tax Assessment Total Assessment is a certain percentage of the fair market value that is determined by local assessors to be the total taxable value of land and additions on the property. | Land | Improvement |
|---|---|---|---|---|
| 2025 | $2,569 | $139,633 | $51,240 | $88,393 |
| 2024 | $2,484 | $136,896 | $50,236 | $86,660 |
| 2023 | $2,484 | $134,212 | $49,251 | $84,961 |
| 2022 | $2,458 | $131,582 | $48,286 | $83,296 |
| 2021 | $2,362 | $129,003 | $47,340 | $81,663 |
| 2019 | $2,279 | $125,179 | $45,937 | $79,242 |
| 2018 | $2,196 | $122,726 | $45,037 | $77,689 |
| 2017 | $2,124 | $120,320 | $44,154 | $76,166 |
| 2016 | $2,050 | $117,962 | $43,289 | $74,673 |
| 2015 | $2,005 | $116,191 | $42,639 | $73,552 |
| 2014 | $1,932 | $113,916 | $41,804 | $72,112 |
Source: Public Records
Map
Nearby Homes
- 2113 Lemontree Way Unit 3
- 2101 Lemontree Way Unit 3
- 2118 Peppertree Way Unit 4
- 2301 Lemontree Way Unit 1
- 2304 Peppertree Way Unit 4
- 2404 Lemontree Ct Unit 1
- 2209 Peppertree Way Unit 1
- 1701 Mahogany Way Unit 38
- 1701 Mahogany Way Unit 47
- 1707 Mahogany Way Unit 63
- 2101 L St
- 2401 Peppertree Ct Unit 4
- 2405 Peppertree Ct Unit 4
- 2410 Shadow Ln Unit 92
- 2416 Shadow Ln Unit 74
- 1228 Buchanan Rd
- 2400 Horizon Ln Unit 136
- 2415 Starlight Ln Unit 155
- 1017 W 14th St
- 1810 San Jose Dr
- 2109 Manzanita Way
- 2113 Manzanita Way Unit A
- 2105 Manzanita Way
- 2117 Manzanita Way
- 1401 Sycamore Dr
- 2108 Manzanita Way
- 2112 Manzanita Way
- 2104 Manzanita Way
- 2201 Manzanita Way Unit A
- 2116 Manzanita Way
- 1411 Sycamore Dr
- 2200 Manzanita Way
- 2205 Manzanita Way
- 2108 Lemontree Way Unit 4
- 2108 Lemontree Way Unit 3
- 2108 Lemontree Way Unit 2
- 2108 Lemontree Way Unit 1
- 2112 Lemontree Way
- 2112 Lemontree Way
- 2112 Lemontree Way Unit 4