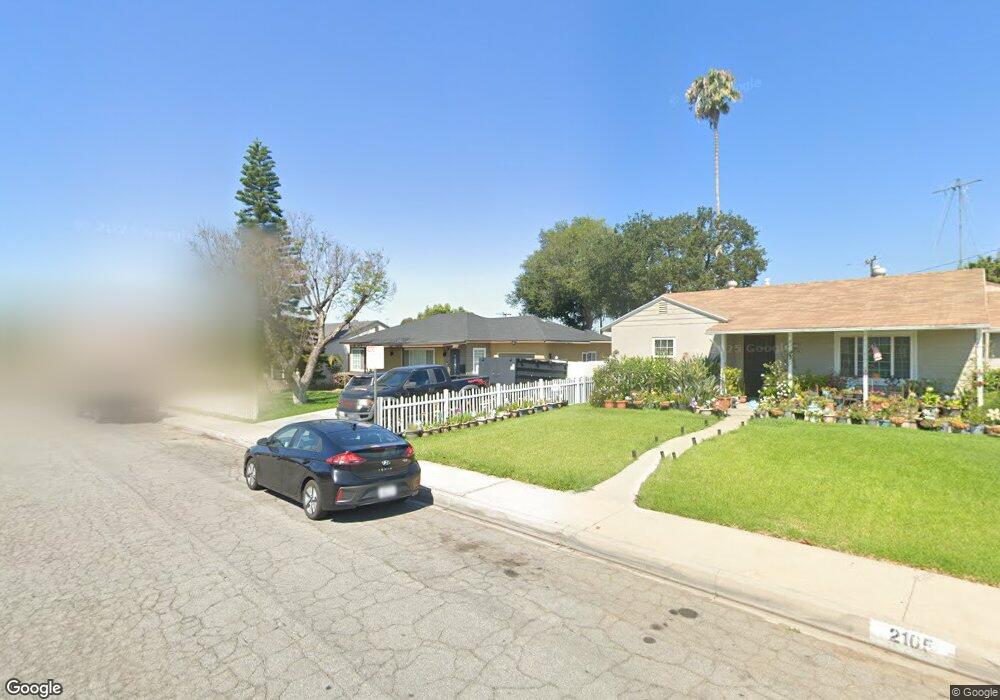
2109 S Isabella Ave Monterey Park, CA 91754
Estimated Value: $830,306 - $978,000
2
Beds
2
Baths
1,059
Sq Ft
$844/Sq Ft
Est. Value
About This Home
This home is located at 2109 S Isabella Ave, Monterey Park, CA 91754 and is currently estimated at $894,077, approximately $844 per square foot. 2109 S Isabella Ave is a home located in Los Angeles County with nearby schools including Bella Vista Elementary School, Macy Intermediate School, and Schurr High School.
Ownership History
Date
Name
Owned For
Owner Type
Purchase Details
Closed on
Jun 2, 2013
Sold by
Rosas Jose A
Bought by
Rosas Ivette and Rosas Jose A
Current Estimated Value
Purchase Details
Closed on
Jan 28, 2003
Sold by
Shelton Lucile A and The Velma B Royce Trust
Bought by
Rosas Antonio
Home Financials for this Owner
Home Financials are based on the most recent Mortgage that was taken out on this home.
Original Mortgage
$220,000
Outstanding Balance
$91,122
Interest Rate
5.5%
Estimated Equity
$802,955
Create a Home Valuation Report for This Property
The Home Valuation Report is an in-depth analysis detailing your home's value as well as a comparison with similar homes in the area
Home Values in the Area
Average Home Value in this Area
Purchase History
| Date | Buyer | Sale Price | Title Company |
|---|---|---|---|
| Rosas Ivette | -- | Premium Title Of California | |
| Rosas Antonio | $275,000 | Commonwealth Land Title Co |
Source: Public Records
Mortgage History
| Date | Status | Borrower | Loan Amount |
|---|---|---|---|
| Open | Rosas Antonio | $220,000 | |
| Closed | Rosas Antonio | $55,000 |
Source: Public Records
Tax History Compared to Growth
Tax History
| Year | Tax Paid | Tax Assessment Tax Assessment Total Assessment is a certain percentage of the fair market value that is determined by local assessors to be the total taxable value of land and additions on the property. | Land | Improvement |
|---|---|---|---|---|
| 2025 | $5,264 | $398,270 | $318,624 | $79,646 |
| 2024 | $5,264 | $390,462 | $312,377 | $78,085 |
| 2023 | $5,273 | $382,806 | $306,252 | $76,554 |
| 2022 | $5,093 | $375,301 | $300,248 | $75,053 |
| 2021 | $4,920 | $367,943 | $294,361 | $73,582 |
| 2019 | $4,729 | $357,031 | $285,631 | $71,400 |
| 2018 | $4,809 | $350,031 | $280,031 | $70,000 |
| 2016 | $4,601 | $336,441 | $269,158 | $67,283 |
| 2015 | $4,319 | $331,388 | $265,115 | $66,273 |
| 2014 | $4,262 | $324,897 | $259,922 | $64,975 |
Source: Public Records
Map
Nearby Homes
- 105 E Floral Dr
- 109 E Hammel St
- 2012 S Garfield Ave
- 150 E Floral Dr
- 500 A S Garfield Unit A
- 269 E Markland Dr
- 1800 Fernbank Ave
- 413 W Riggin St
- 1701 S Mcpherrin Ave
- 1804 Wilcox Ave
- 498 W Riggin St
- 352 E Riggin St
- 532 W Gleason St
- 1100 S Grandridge Ave
- 833 Findlay Ave
- 1351 S Ynez Ave
- 1240 S Ynez Ave
- 1594 Trumbower Ave
- 2000 Fulton Ave
- 3613 Via Campo
- 2105 S Isabella Ave
- 2113 S Isabella Ave
- 2049 Fernbank Ave
- 2116 Graylock Ave
- 2101 S Isabella Ave
- 2120 Graylock Ave
- 2112 Graylock Ave
- 2108 S Isabella Ave
- 2104 Graylock Ave
- 2112 S Isabella Ave
- 2045 Fernbank Ave
- 2104 S Isabella Ave
- 200 W Floral Dr
- 2100 S Isabella Ave
- 2100 Graylock Ave
- 204 W Floral Dr
- 2041 Fernbank Ave
- 2200 S Isabella Ave
- 2045 S Isabella Ave
- 208 W Floral Dr