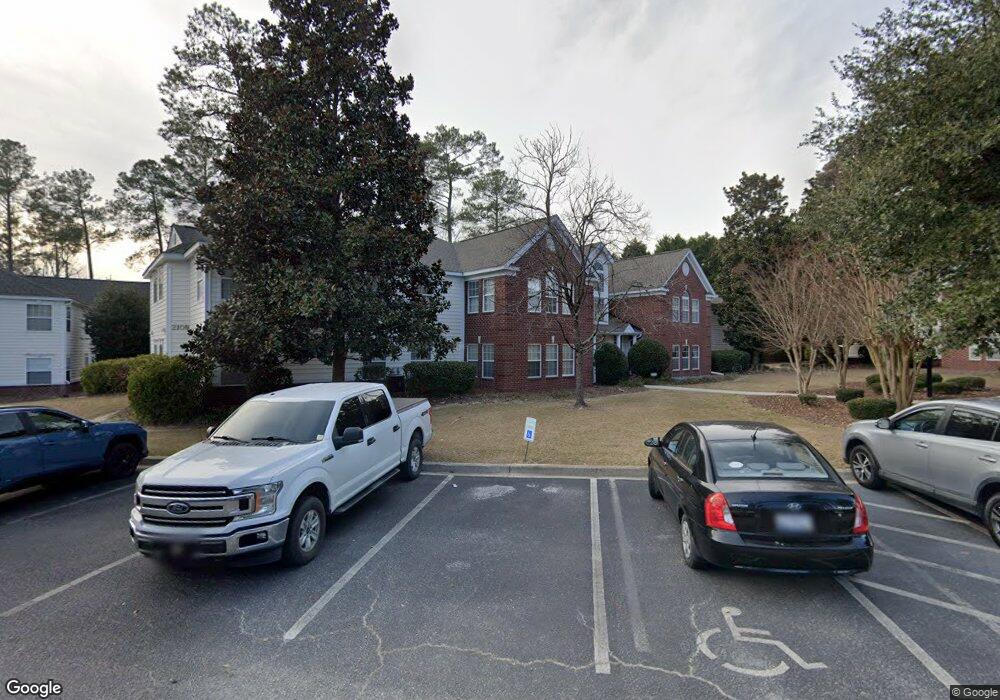
2109 Sanderling Dr Unit A Florence, SC 29505
Estimated Value: $125,523 - $209,000
3
Beds
2
Baths
1,402
Sq Ft
$117/Sq Ft
Est. Value
About This Home
This home is located at 2109 Sanderling Dr Unit A, Florence, SC 29505 and is currently estimated at $164,131, approximately $117 per square foot. 2109 Sanderling Dr Unit A is a home located in Florence County with nearby schools including McLaurin Elementary School, Southside Middle School, and South Florence High School.
Ownership History
Date
Name
Owned For
Owner Type
Purchase Details
Closed on
Aug 17, 2022
Sold by
Ann Martines Sheree
Bought by
May Mary K
Current Estimated Value
Purchase Details
Closed on
Jul 19, 2022
Sold by
Spencer May Carryl
Bought by
May Mary K
Purchase Details
Closed on
Feb 7, 2022
Sold by
Le May Mary K
Bought by
May Darryl Spencer
Purchase Details
Closed on
Jul 12, 2021
Sold by
Hall Katelyn M and Hall Steven C
Bought by
May Mary K
Purchase Details
Closed on
Sep 7, 2017
Sold by
Matthews Amelia I and Poston Bath I
Bought by
Hall Katelyn M and Hall Steven C
Home Financials for this Owner
Home Financials are based on the most recent Mortgage that was taken out on this home.
Original Mortgage
$80,000
Interest Rate
3.92%
Mortgage Type
New Conventional
Purchase Details
Closed on
May 20, 2016
Sold by
Croft Dana I
Bought by
Croft Kelsey Elizabeth
Purchase Details
Closed on
Apr 26, 2016
Sold by
Estate Of Zeta P Isgett and Matthew Amelia I
Bought by
Matthews Amelia I and Mims Cheryl R
Create a Home Valuation Report for This Property
The Home Valuation Report is an in-depth analysis detailing your home's value as well as a comparison with similar homes in the area
Home Values in the Area
Average Home Value in this Area
Purchase History
| Date | Buyer | Sale Price | Title Company |
|---|---|---|---|
| May Mary K | -- | Crawford Gary W | |
| May Mary K | -- | Crawford Gary W | |
| May Mary K | -- | Crawford Gary W | |
| May Mary K | -- | Crawford Gary W | |
| May Darryl Spencer | -- | Crawford Gary W | |
| May Mary K | $125,000 | None Available | |
| Hall Katelyn M | $95,000 | None Available | |
| Croft Kelsey Elizabeth | -- | -- | |
| Matthews Amelia I | -- | -- |
Source: Public Records
Mortgage History
| Date | Status | Borrower | Loan Amount |
|---|---|---|---|
| Previous Owner | Hall Katelyn M | $80,000 |
Source: Public Records
Tax History Compared to Growth
Tax History
| Year | Tax Paid | Tax Assessment Tax Assessment Total Assessment is a certain percentage of the fair market value that is determined by local assessors to be the total taxable value of land and additions on the property. | Land | Improvement |
|---|---|---|---|---|
| 2024 | $2,982 | $5,692 | $280 | $5,412 |
| 2023 | $2,655 | $4,956 | $280 | $4,676 |
| 2022 | $2,676 | $4,956 | $280 | $4,676 |
| 2021 | $498 | $3,800 | $0 | $0 |
| 2020 | $465 | $3,800 | $0 | $0 |
| 2019 | $435 | $3,796 | $280 | $3,516 |
| 2018 | $430 | $3,800 | $0 | $0 |
| 2017 | $1,883 | $5,760 | $0 | $0 |
| 2016 | $1,841 | $5,760 | $0 | $0 |
| 2015 | $175 | $3,840 | $0 | $0 |
| 2014 | $152 | $3,836 | $280 | $3,556 |
Source: Public Records
Map
Nearby Homes
- 2141 Elderberry Dr
- 1193 Waxwing Dr
- 2136 Sumac Dr
- 1110 3rd Loop Rd
- 1189 Waxwing Dr
- 1914 Brigadoone Ln
- 1311 Queens Ferry Rd
- 2211 Amberleigh Ct
- 1807 Nottingham Dr
- 1971 S Mcclellan St
- 920 Charlestowne Blvd
- 1768 Marsh Ave
- 1880 S Walter Dr
- 926 3rd Loop Rd
- 1871 Jason Dr
- 922 3rd Loop Rd
- 1804 Woods Dr
- 2369 S Hallmark Dr
- 1770 Woods Dr
- 1717 Full Moon Rd
- 2109 Sanderling Dr Unit E
- 2109 Sanderling Dr Unit 2109F
- 2109 Sanderling Dr
- 2109 Sanderling Dr Unit 4
- 2109 Sanderling Dr Unit B
- 2109 Sanderling Dr Unit H
- 0 2109 Unit G Sanderling Dr
- 2109 Unit G Sanderling Dr
- 2109 Sanderling Dr
- 2109 Sanderling Drive-Unit H
- 2113 Sanderling Dr
- 2113 Sanderling Dr Unit E
- 2113 Sanderling Dr Unit D
- 2113 Sanderling Dr Unit 2113G
- 2113 Sanderling Dr Unit C
- 2113 Sanderling Dr Unit F
- 2113 Sanderling Dr Unit B
- 2105 Sanderling Dr Unit 2105A
- 2105 Sanderling Dr
- 2105 Sanderling Dr Unit B