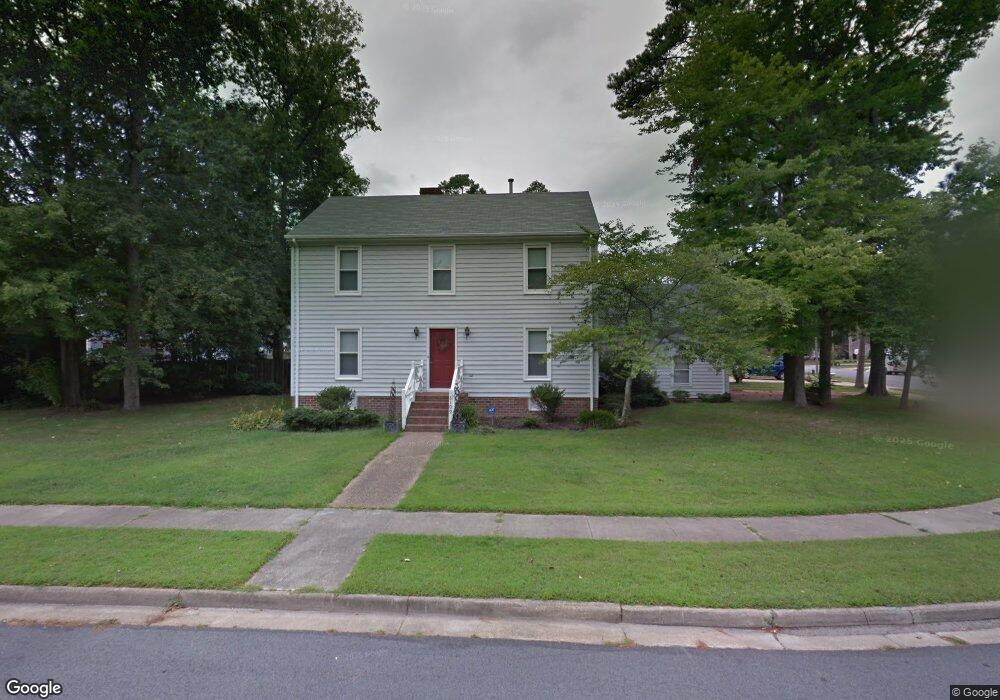
2109 Tall Pines Bend Virginia Beach, VA 23456
Dam Neck NeighborhoodEstimated Value: $529,000 - $549,144
3
Beds
3
Baths
2,214
Sq Ft
$244/Sq Ft
Est. Value
About This Home
This home is located at 2109 Tall Pines Bend, Virginia Beach, VA 23456 and is currently estimated at $540,036, approximately $243 per square foot. 2109 Tall Pines Bend is a home located in Virginia Beach City with nearby schools including Strawbridge Elementary School, Princess Anne Middle School, and Floyd E. Kellam High School.
Ownership History
Date
Name
Owned For
Owner Type
Purchase Details
Closed on
Feb 2, 2021
Sold by
Dore Elba and Dore Francis K
Bought by
Bryant Hudson
Current Estimated Value
Home Financials for this Owner
Home Financials are based on the most recent Mortgage that was taken out on this home.
Original Mortgage
$380,000
Outstanding Balance
$339,868
Interest Rate
2.7%
Mortgage Type
New Conventional
Estimated Equity
$200,168
Purchase Details
Closed on
May 31, 2017
Sold by
Juster James J and Juster Kathleen M
Bought by
Dore Elba and Dore Francis K
Home Financials for this Owner
Home Financials are based on the most recent Mortgage that was taken out on this home.
Original Mortgage
$318,708
Interest Rate
3.97%
Mortgage Type
VA
Purchase Details
Closed on
Oct 17, 2003
Sold by
Brown Kim F Costello
Bought by
Juster James J
Home Financials for this Owner
Home Financials are based on the most recent Mortgage that was taken out on this home.
Original Mortgage
$243,600
Interest Rate
6.43%
Mortgage Type
New Conventional
Create a Home Valuation Report for This Property
The Home Valuation Report is an in-depth analysis detailing your home's value as well as a comparison with similar homes in the area
Home Values in the Area
Average Home Value in this Area
Purchase History
| Date | Buyer | Sale Price | Title Company |
|---|---|---|---|
| Bryant Hudson | $400,000 | Fidelity National Ttl Ins Co | |
| Dore Elba | $312,000 | Advance Title & Abstract | |
| Juster James J | $245,000 | -- |
Source: Public Records
Mortgage History
| Date | Status | Borrower | Loan Amount |
|---|---|---|---|
| Open | Bryant Hudson | $380,000 | |
| Previous Owner | Dore Elba | $318,708 | |
| Previous Owner | Juster James J | $243,600 |
Source: Public Records
Tax History Compared to Growth
Tax History
| Year | Tax Paid | Tax Assessment Tax Assessment Total Assessment is a certain percentage of the fair market value that is determined by local assessors to be the total taxable value of land and additions on the property. | Land | Improvement |
|---|---|---|---|---|
| 2025 | $4,384 | $462,000 | $175,000 | $287,000 |
| 2024 | $4,384 | $452,000 | $164,000 | $288,000 |
| 2023 | $4,279 | $432,200 | $154,000 | $278,200 |
| 2022 | $4,108 | $414,900 | $140,000 | $274,900 |
| 2021 | $3,478 | $351,300 | $130,000 | $221,300 |
| 2020 | $3,592 | $353,000 | $124,000 | $229,000 |
| 2019 | $3,365 | $330,700 | $124,000 | $206,700 |
| 2018 | $3,315 | $330,700 | $124,000 | $206,700 |
| 2017 | $3,122 | $311,400 | $124,000 | $187,400 |
| 2016 | $3,006 | $303,600 | $124,000 | $179,600 |
| 2015 | $2,899 | $292,800 | $124,000 | $168,800 |
| 2014 | $2,662 | $290,500 | $124,000 | $166,500 |
Source: Public Records
Map
Nearby Homes
- 2305 Wheatstone Ct
- 1808 Kensal Green Dr
- 2304 Apple Tree Crescent
- 2641 Springhaven Dr
- 2436 Pitchfork Way
- 2569 Springhaven Dr
- 2309 Seaboard Rd
- 2537 Springhaven Dr
- 2277 Huckleberry Trail
- 2424 Huckleberry Trail
- 2417 Hay Bale Ln
- 2385 Huckleberry Trail
- 1700 Mayberry Dr
- 2033 Ealing Crescent
- 2412 Hay Bale Ln
- 1306 Tuscany Dr
- 2321 Mathews Green Rd
- 2629 Mulberry Loop
- 2505 Shea Cir
- 2320 Pierce Ln
- 2105 Tall Pines Bend
- 2117 Tall Pines Bend
- 2101 Tall Pines Bend
- 2405 Windy Pines Bend
- 2104 Tall Pines Bend
- 2121 Tall Pines Bend
- 2108 Tall Pines Bend
- 2409 Windy Pines Bend
- 2349 Windy Pines Bend
- 2116 Tall Pines Bend
- 2112 Tall Pines Bend
- 2120 Tall Pines Bend
- 2125 Tall Pines Bend
- 2413 Windy Pines Bend
- 1945 Pine View Ave
- 1941 Pine View Ave
- 2124 Tall Pines Bend
- 1949 Pine View Ave
- 2400 Windy Pines Bend
- 2404 Windy Pines Bend