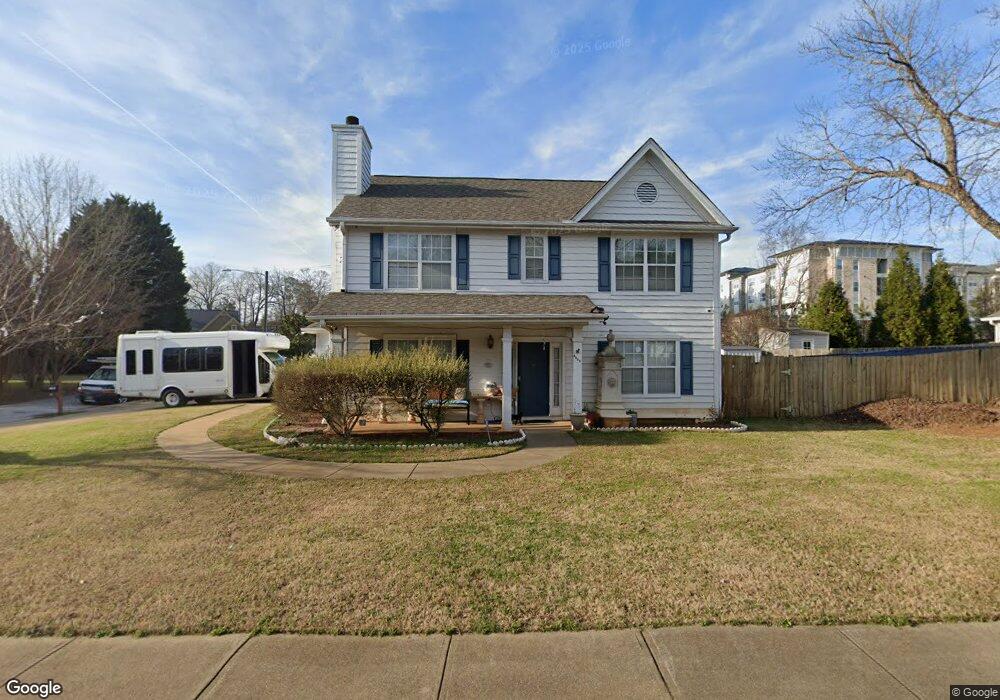
2109 Windstream Trace SW Marietta, GA 30060
Southwestern Marietta NeighborhoodEstimated Value: $368,000 - $380,000
3
Beds
3
Baths
2,051
Sq Ft
$182/Sq Ft
Est. Value
About This Home
This home is located at 2109 Windstream Trace SW, Marietta, GA 30060 and is currently estimated at $373,748, approximately $182 per square foot. 2109 Windstream Trace SW is a home located in Cobb County with nearby schools including LaBelle Elementary School, Smitha Middle School, and Osborne High School.
Ownership History
Date
Name
Owned For
Owner Type
Purchase Details
Closed on
Oct 21, 2003
Sold by
Sabella Paul A
Bought by
Martinez Maria
Current Estimated Value
Home Financials for this Owner
Home Financials are based on the most recent Mortgage that was taken out on this home.
Original Mortgage
$154,000
Outstanding Balance
$70,407
Interest Rate
6.03%
Mortgage Type
New Conventional
Estimated Equity
$303,341
Purchase Details
Closed on
Dec 29, 1998
Sold by
Cantrell David J and Lori Ann
Bought by
Sabella Paul A
Home Financials for this Owner
Home Financials are based on the most recent Mortgage that was taken out on this home.
Original Mortgage
$94,000
Interest Rate
6.87%
Mortgage Type
New Conventional
Purchase Details
Closed on
Aug 18, 1995
Sold by
Cos Knight Davidson
Bought by
Cantrell David J Lori Ann
Create a Home Valuation Report for This Property
The Home Valuation Report is an in-depth analysis detailing your home's value as well as a comparison with similar homes in the area
Home Values in the Area
Average Home Value in this Area
Purchase History
| Date | Buyer | Sale Price | Title Company |
|---|---|---|---|
| Martinez Maria | $154,000 | -- | |
| Sabella Paul A | $117,500 | -- | |
| Cantrell David J Lori Ann | $106,200 | -- |
Source: Public Records
Mortgage History
| Date | Status | Borrower | Loan Amount |
|---|---|---|---|
| Open | Martinez Maria | $154,000 | |
| Previous Owner | Sabella Paul A | $94,000 | |
| Closed | Cantrell David J Lori Ann | $0 |
Source: Public Records
Tax History
| Year | Tax Paid | Tax Assessment Tax Assessment Total Assessment is a certain percentage of the fair market value that is determined by local assessors to be the total taxable value of land and additions on the property. | Land | Improvement |
|---|---|---|---|---|
| 2025 | $3,653 | $160,408 | $28,000 | $132,408 |
| 2024 | $3,656 | $160,408 | $28,000 | $132,408 |
| 2023 | $2,124 | $114,800 | $28,000 | $86,800 |
Source: Public Records
Map
Nearby Homes
- 1899 Austell Rd SW
- 162 Summer Lake Dr SW
- 1809 Austell Rd SW
- 108 Hollinger Way
- 1763 Sandtown Rd SW
- 166 Zelma St SW
- 2307 Favor Rd SW
- 187 Privette Rd SW
- 2245 Panstone Dr SW
- 1911 Olive Springs Rd SE
- 154 Privette Rd SW
- 12 Peachtree Cir SE
- 1615 Arden Dr SW
- 1958 Judy Cir SE
- 2410 Sandtown Rd SW
- 29 Burke St SE
- 1706 Cunningham Rd SW
- 1485 Brandon Dr SW
- 2162 Wakita Dr SE
- 141 Dunleith Pkwy SW
- 2107 Windstream Trace SW Unit 31
- 2107 Windstream Trace SW
- 420 Windstream Dr SW
- 2105 Windstream Trace SW
- 426 Windstream Dr SW
- 421 Windstream Dr SW
- 418 Windstream Dr SW
- 2175 Windstream Ln SW
- 2176 Windstream Ln SW
- 425 Windstream Dr SW
- 428 Windstream Dr SW
- 416 Windstream Dr SW
- 427 Windstream Dr SW
- 2103 Windstream Trace SW
- 2106 Windstream Trace SW
- 429 Windstream Dr SW
- 2178 Windstream Ln SW
- 2102 Windstream Trace SW
- 413 Windstream Dr SW
Your Personal Tour Guide
Ask me questions while you tour the home.