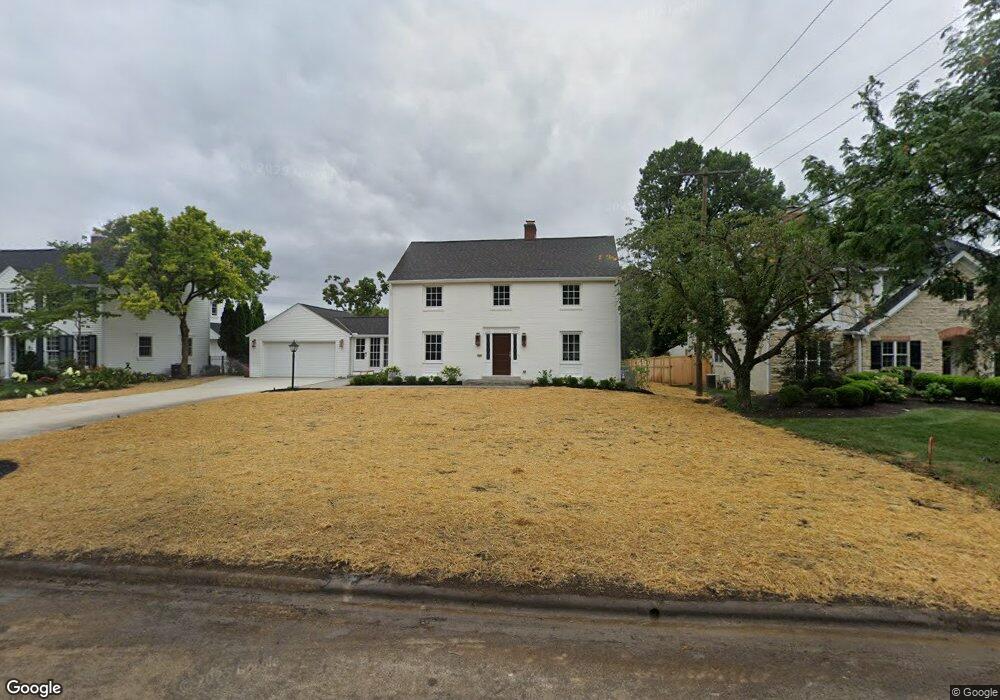
2109 Yorkshire Rd Columbus, OH 43221
Estimated Value: $1,164,000 - $1,314,000
3
Beds
4
Baths
2,820
Sq Ft
$444/Sq Ft
Est. Value
About This Home
This home is located at 2109 Yorkshire Rd, Columbus, OH 43221 and is currently estimated at $1,252,293, approximately $444 per square foot. 2109 Yorkshire Rd is a home located in Franklin County with nearby schools including Barrington Road Elementary School, Jones Middle School, and Upper Arlington High School.
Ownership History
Date
Name
Owned For
Owner Type
Purchase Details
Closed on
Nov 7, 2025
Sold by
Christopher R Miller R and Christopher Lindsay J
Bought by
Dehays Brad and Dehays Jaeleen Clark
Current Estimated Value
Purchase Details
Closed on
Sep 8, 2023
Sold by
Miller Lindsay J
Bought by
Christopher R Miller And Lindsay J Miller Rev and Miller
Purchase Details
Closed on
May 15, 2023
Sold by
Arnold L Jack Trust
Bought by
Miller Lindsay J
Purchase Details
Closed on
Sep 9, 2009
Sold by
Jack Susan E
Bought by
Jack Arnold L
Purchase Details
Closed on
Dec 30, 1991
Bought by
Jack Arnold L
Purchase Details
Closed on
Jul 20, 1987
Purchase Details
Closed on
Sep 1, 1978
Create a Home Valuation Report for This Property
The Home Valuation Report is an in-depth analysis detailing your home's value as well as a comparison with similar homes in the area
Home Values in the Area
Average Home Value in this Area
Purchase History
| Date | Buyer | Sale Price | Title Company |
|---|---|---|---|
| Dehays Brad | $1,300,000 | Chicago Title | |
| Christopher R Miller And Lindsay J Miller Rev | -- | None Listed On Document | |
| Miller Lindsay J | -- | None Listed On Document | |
| Jack Arnold L | -- | Attorney | |
| Jack Arnold L | -- | -- | |
| -- | $167,000 | -- | |
| -- | $105,500 | -- |
Source: Public Records
Tax History
| Year | Tax Paid | Tax Assessment Tax Assessment Total Assessment is a certain percentage of the fair market value that is determined by local assessors to be the total taxable value of land and additions on the property. | Land | Improvement |
|---|---|---|---|---|
| 2025 | $17,338 | $291,900 | $136,430 | $155,470 |
| 2024 | $17,338 | $291,900 | $136,430 | $155,470 |
| 2023 | $16,689 | $291,900 | $136,430 | $155,470 |
| 2022 | $12,684 | $190,270 | $99,230 | $91,040 |
| 2021 | $11,228 | $190,270 | $99,230 | $91,040 |
| 2020 | $11,129 | $190,270 | $99,230 | $91,040 |
| 2019 | $11,519 | $174,870 | $99,230 | $75,640 |
| 2018 | $10,713 | $174,870 | $99,230 | $75,640 |
| 2017 | $11,431 | $174,870 | $99,230 | $75,640 |
| 2016 | $9,836 | $157,510 | $92,720 | $64,790 |
| 2015 | $9,972 | $157,510 | $92,720 | $64,790 |
| 2014 | $9,838 | $157,510 | $92,720 | $64,790 |
| 2013 | $5,320 | $159,810 | $84,280 | $75,530 |
Source: Public Records
Map
Nearby Homes
- 2167 Fairfax Rd
- 1960 Hillside Dr
- 2367 Southway Dr
- 1869 Tewksbury Rd
- 2329 Keep Place Unit 2329
- 2245 Riverside Dr Unit 309
- 2583 Wexford Rd
- 2031 Concord Rd
- 2022 Lake Shore Dr
- 1631 Roxbury Rd Unit A1
- 1631 Roxbury Rd Unit F3
- 1631 Roxbury Rd Unit B6
- 2015 W 5th Ave Unit 211
- 2015 W 5th Ave Unit 102
- 2015 W 5th Ave Unit 108
- 1579 Arlington Ave Unit 1579B
- 2000 Northwest Blvd Unit D
- 2748 Tremont Rd
- 2704 Scioto Station Dr Unit 2704
- 1565 Berkshire Rd
- 2121 Yorkshire Rd
- 2101 Yorkshire Rd
- 2100 Cheshire Rd
- 2090 Cheshire Rd
- 2129 Yorkshire Rd
- 2110 Cheshire Rd
- 2091 Yorkshire Rd
- 2080 Cheshire Rd
- 2114 Yorkshire Rd
- 2120 Cheshire Rd
- 2104 Yorkshire Rd
- 2124 Yorkshire Rd
- 2137 Yorkshire Rd
- 2130 Cheshire Rd
- 2070 Cheshire Rd
- 2092 Yorkshire Rd
- 0 Yorkshire Rd
- 2147 Yorkshire Rd
- 2095 Cheshire Rd
- 2085 Cheshire Rd
Your Personal Tour Guide
Ask me questions while you tour the home.