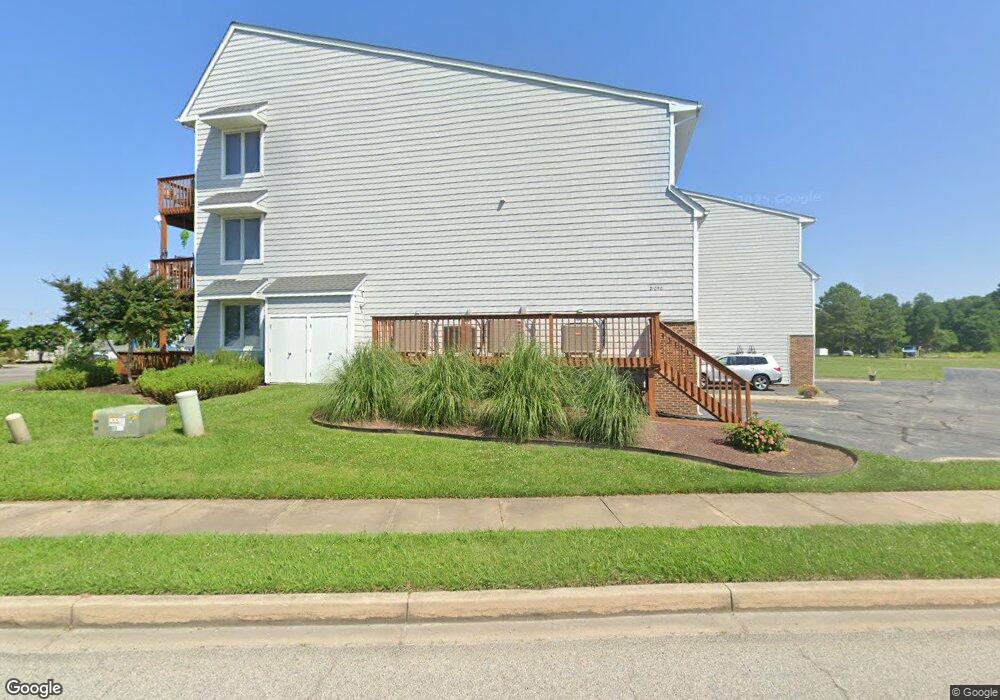
21090 W Sharp St Rock Hall, MD 21661
Estimated Value: $447,996 - $569,000
Studio
2
Baths
1,650
Sq Ft
$314/Sq Ft
Est. Value
About This Home
This home is located at 21090 W Sharp St, Rock Hall, MD 21661 and is currently estimated at $517,499, approximately $313 per square foot. 21090 W Sharp St is a home located in Kent County with nearby schools including Kent County Middle School and Kent County High School.
Ownership History
Date
Name
Owned For
Owner Type
Purchase Details
Closed on
Jul 13, 2020
Sold by
Johnson Gary J and Johnson Jennifer F
Bought by
Renzi John
Current Estimated Value
Home Financials for this Owner
Home Financials are based on the most recent Mortgage that was taken out on this home.
Original Mortgage
$278,800
Outstanding Balance
$247,221
Interest Rate
3.1%
Mortgage Type
New Conventional
Estimated Equity
$270,278
Purchase Details
Closed on
May 1, 2014
Sold by
Cooke John H
Bought by
Johnson Gary J and Johnson Jennifer F
Purchase Details
Closed on
Aug 24, 2004
Sold by
Coffin Albert A and Coffin Deborah J.
Bought by
B. Cooke John H and B. Darlene
Purchase Details
Closed on
Dec 23, 1992
Sold by
Schwandt Hugo B and Schwandt Sara G
Bought by
Coffin Albert A and Coffin Deborah J
Purchase Details
Closed on
Jun 15, 1992
Sold by
Yarmouth Partners
Bought by
Schwandt Hugo B and Schwandt Sara G
Create a Home Valuation Report for This Property
The Home Valuation Report is an in-depth analysis detailing your home's value as well as a comparison with similar homes in the area
Purchase History
| Date | Buyer | Sale Price | Title Company |
|---|---|---|---|
| Renzi John | $328,000 | None Available | |
| Johnson Gary J | $370,000 | None Available | |
| B. Cooke John H | $400,000 | -- | |
| Coffin Albert A | $160,000 | -- | |
| Schwandt Hugo B | $127,500 | -- |
Source: Public Records
Mortgage History
| Date | Status | Borrower | Loan Amount |
|---|---|---|---|
| Open | Renzi John | $278,800 |
Source: Public Records
Tax History
| Year | Tax Paid | Tax Assessment Tax Assessment Total Assessment is a certain percentage of the fair market value that is determined by local assessors to be the total taxable value of land and additions on the property. | Land | Improvement |
|---|---|---|---|---|
| 2025 | $5,627 | $371,667 | $0 | $0 |
| 2024 | $4,877 | $320,000 | $140,000 | $180,000 |
| 2023 | $4,877 | $320,000 | $140,000 | $180,000 |
| 2022 | $4,813 | $320,000 | $140,000 | $180,000 |
| 2020 | $5,356 | $363,333 | $0 | $0 |
| 2019 | $5,184 | $351,667 | $0 | $0 |
| 2018 | $4,944 | $340,000 | $150,000 | $190,000 |
| 2017 | $4,944 | $340,000 | $0 | $0 |
| 2016 | -- | $340,000 | $0 | $0 |
| 2015 | -- | $340,000 | $0 | $0 |
| 2014 | $5,496 | $340,000 | $0 | $0 |
Source: Public Records
Map
Nearby Homes
- 21090 W Sharp St Unit 133
- 21090 W Sharp St Unit 112
- 21103 Striper Run
- 21186 Chesapeake Ave
- 5807 Blue Claw Ct
- 5786 S Hawthorne Ave
- 21124 Striper Run
- 21131 Striper Run
- 21133 Striper Run
- 5827 S Hawthorne Ave
- 21235 Rock Hall Ave
- 20992 Rock Hall Ave
- 0 Judefind Ave Unit MDKE2001688
- 20812 Mercer Ave
- 5916 N Main St
- 5898 Williams St
- 0 Sharp St Unit MDKE2005760
- 5883 Williams St
- 21305 Haven Rd
- 21447 E Sharp St
- 21090 W Sharp St Unit 132
- 21090 W Sharp St
- 21090 W Sharp St
- 21090 W Sharp St
- 21090 W Sharp St
- 21090 W Sharp St
- 21090 W Sharp St
- 21090 W Sharp St
- 21090 W Sharp St Unit 123
- 21090 W Sharp St Unit 142
- 21090 W Sharp St Unit 122
- 21090 W Sharp St Unit 113
- 21090 W Sharp St Unit 143
- 5657 S Hawthorne Ave
- 21096 W Sharp St
- 21096 Chesapeake Ave
- 21053 W Sharp St
- 21083 Chesapeake Ave
- 21103 W Sharp St
- 21108 W Sharp St Unit F057
Your Personal Tour Guide
Ask me questions while you tour the home.