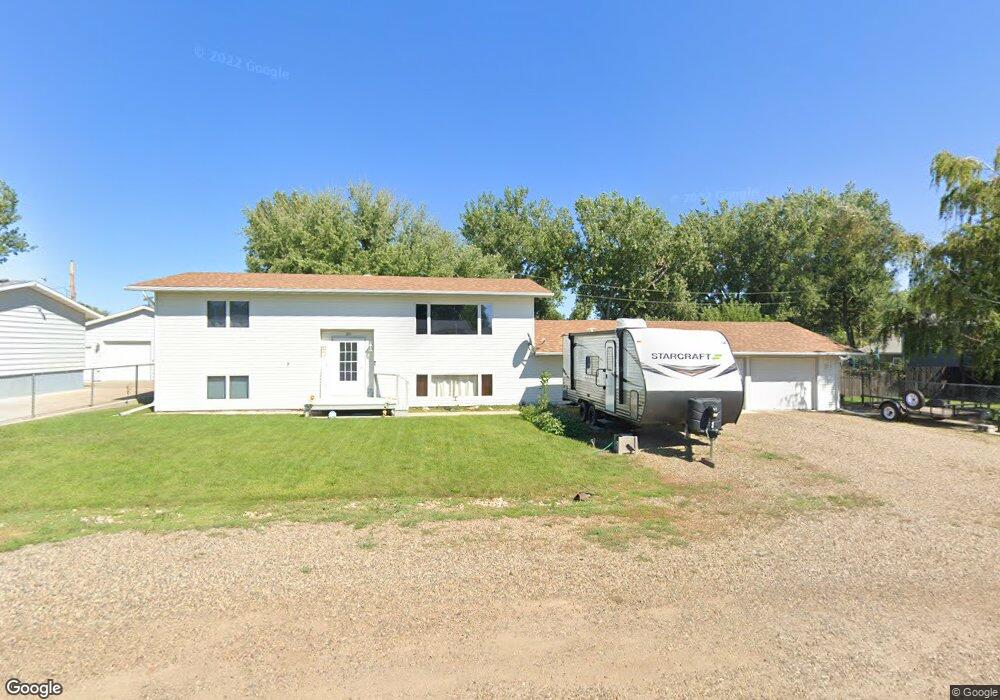
211 4th St Glendive, MT 59330
Estimated Value: $193,000 - $281,653
4
Beds
2
Baths
1,002
Sq Ft
$235/Sq Ft
Est. Value
About This Home
This home is located at 211 4th St, Glendive, MT 59330 and is currently estimated at $235,163, approximately $234 per square foot. 211 4th St is a home located in Dawson County with nearby schools including Dawson High School and Valley View Seventh-day Adventist School.
Ownership History
Date
Name
Owned For
Owner Type
Purchase Details
Closed on
Oct 8, 2019
Sold by
Spencer Inv Hldgs Llc
Bought by
Garrett Swandal P
Current Estimated Value
Home Financials for this Owner
Home Financials are based on the most recent Mortgage that was taken out on this home.
Original Mortgage
$163,636
Outstanding Balance
$143,353
Interest Rate
3.5%
Mortgage Type
Construction
Estimated Equity
$91,810
Purchase Details
Closed on
Jul 13, 1993
Bought by
Spencer Inc
Create a Home Valuation Report for This Property
The Home Valuation Report is an in-depth analysis detailing your home's value as well as a comparison with similar homes in the area
Home Values in the Area
Average Home Value in this Area
Purchase History
| Date | Buyer | Sale Price | Title Company |
|---|---|---|---|
| Garrett Swandal P | $204,545 | First American Title | |
| Spencer Inc | -- | -- |
Source: Public Records
Mortgage History
| Date | Status | Borrower | Loan Amount |
|---|---|---|---|
| Open | Garrett Swandal P | $163,636 | |
| Closed | Garrett Swandal P | $163,636 |
Source: Public Records
Tax History
| Year | Tax Paid | Tax Assessment Tax Assessment Total Assessment is a certain percentage of the fair market value that is determined by local assessors to be the total taxable value of land and additions on the property. | Land | Improvement |
|---|---|---|---|---|
| 2025 | $2,370 | $227,600 | $0 | $0 |
| 2024 | $2,893 | $180,200 | $0 | $0 |
| 2023 | $2,849 | $180,200 | $0 | $0 |
| 2022 | $2,631 | $156,600 | $0 | $0 |
| 2021 | $1,412 | $156,600 | $0 | $0 |
| 2020 | $1,831 | $144,800 | $0 | $0 |
| 2019 | $1,978 | $160,800 | $0 | $0 |
| 2018 | $2,971 | $226,000 | $0 | $0 |
| 2017 | $1,993 | $226,000 | $0 | $0 |
| 2016 | $2,850 | $193,000 | $0 | $0 |
| 2015 | $1,879 | $193,000 | $0 | $0 |
| 2014 | $1,213 | $70,225 | $0 | $0 |
Source: Public Records
Map
Nearby Homes
Your Personal Tour Guide
Ask me questions while you tour the home.