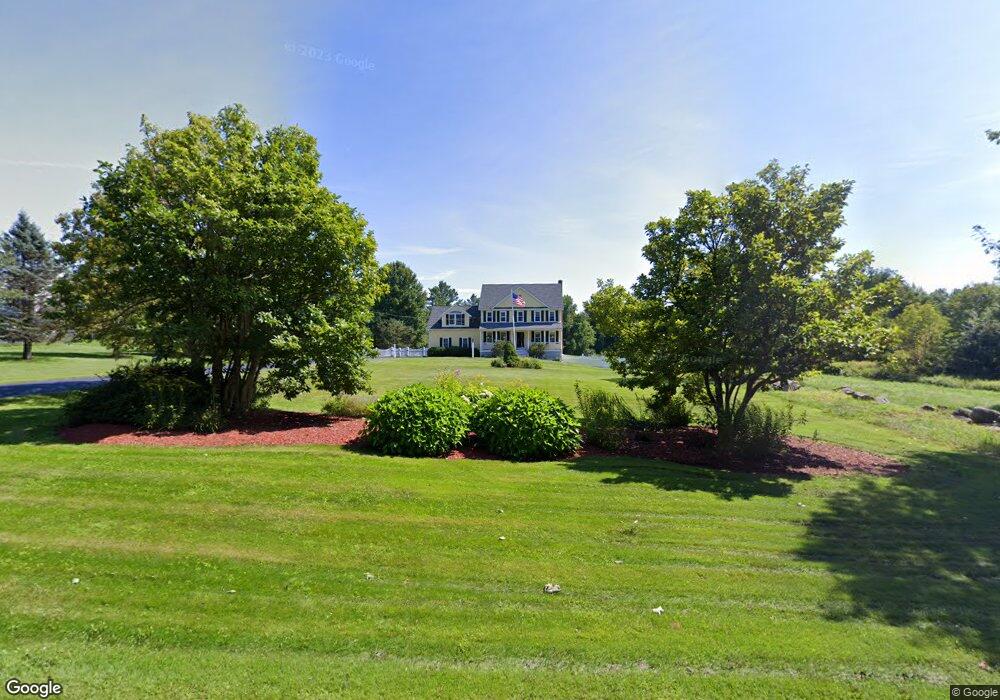
211 8 Lots Rd Sutton, MA 01590
Estimated Value: $774,599 - $1,011,000
3
Beds
3
Baths
2,800
Sq Ft
$330/Sq Ft
Est. Value
About This Home
This home is located at 211 8 Lots Rd, Sutton, MA 01590 and is currently estimated at $923,900, approximately $329 per square foot. 211 8 Lots Rd is a home located in Worcester County with nearby schools including Sutton Elementary School, Sutton Middle School, and Sutton High School.
Ownership History
Date
Name
Owned For
Owner Type
Purchase Details
Closed on
Jul 10, 2009
Sold by
Bergen Kathleen A
Bought by
Zaluski Gregory J and Deyo Andrea S
Current Estimated Value
Purchase Details
Closed on
Oct 17, 1997
Sold by
Chabot Stephen J
Bought by
Braun Shea Timothy E and Braun Shea Kathleen
Home Financials for this Owner
Home Financials are based on the most recent Mortgage that was taken out on this home.
Original Mortgage
$203,100
Interest Rate
7.46%
Mortgage Type
Purchase Money Mortgage
Create a Home Valuation Report for This Property
The Home Valuation Report is an in-depth analysis detailing your home's value as well as a comparison with similar homes in the area
Home Values in the Area
Average Home Value in this Area
Purchase History
| Date | Buyer | Sale Price | Title Company |
|---|---|---|---|
| Zaluski Gregory J | $471,000 | -- | |
| Braun Shea Timothy E | $270,800 | -- |
Source: Public Records
Mortgage History
| Date | Status | Borrower | Loan Amount |
|---|---|---|---|
| Previous Owner | Braun Shea Timothy E | $35,000 | |
| Previous Owner | Braun Shea Timothy E | $203,100 | |
| Closed | Braun Shea Timothy E | $17,700 |
Source: Public Records
Tax History
| Year | Tax Paid | Tax Assessment Tax Assessment Total Assessment is a certain percentage of the fair market value that is determined by local assessors to be the total taxable value of land and additions on the property. | Land | Improvement |
|---|---|---|---|---|
| 2025 | $8,638 | $718,600 | $225,900 | $492,700 |
| 2024 | $8,398 | $662,300 | $193,600 | $468,700 |
| 2023 | $7,843 | $566,300 | $174,500 | $391,800 |
| 2022 | $8,132 | $535,700 | $175,900 | $359,800 |
| 2021 | $6,035 | $500,200 | $175,900 | $324,300 |
| 2020 | $4,858 | $500,200 | $175,900 | $324,300 |
| 2019 | $7,786 | $471,300 | $175,900 | $295,400 |
| 2018 | $4,291 | $453,600 | $175,900 | $277,700 |
| 2017 | $384 | $444,000 | $159,200 | $284,800 |
| 2016 | $7,227 | $433,300 | $159,200 | $274,100 |
| 2015 | $6,825 | $409,200 | $159,200 | $250,000 |
| 2014 | $6,500 | $385,100 | $158,300 | $226,800 |
Source: Public Records
Map
Nearby Homes
Your Personal Tour Guide
Ask me questions while you tour the home.