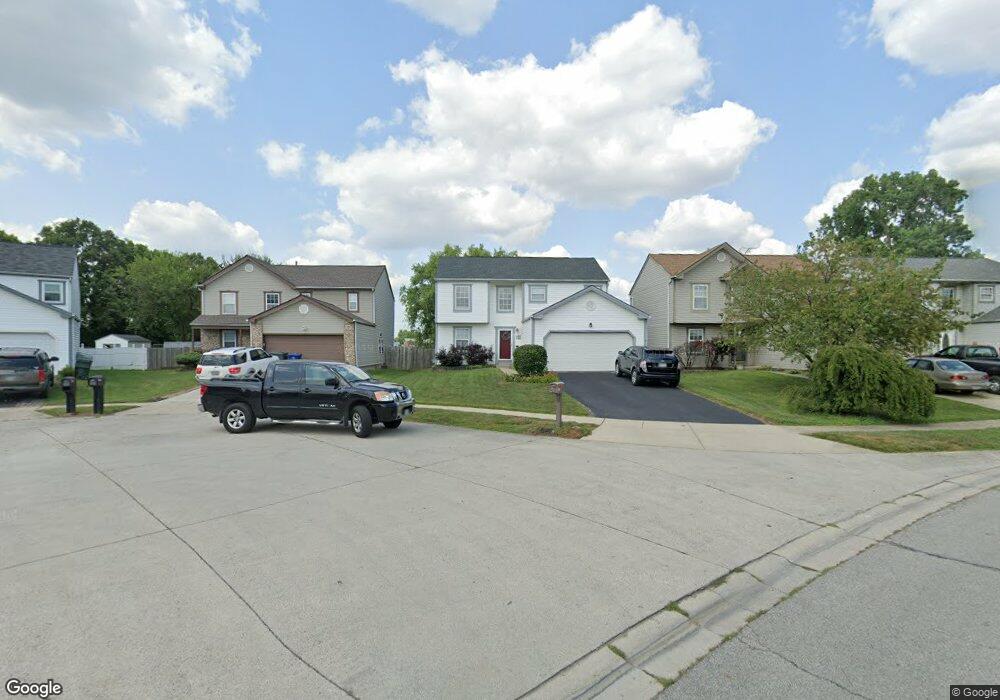
211 Charing Cross St Galloway, OH 43119
Westchester-Green Countrie NeighborhoodEstimated Value: $302,000 - $345,000
4
Beds
3
Baths
1,698
Sq Ft
$191/Sq Ft
Est. Value
About This Home
This home is located at 211 Charing Cross St, Galloway, OH 43119 and is currently estimated at $324,902, approximately $191 per square foot. 211 Charing Cross St is a home located in Franklin County with nearby schools including Darby Woods Elementary School, Galloway Ridge Intermediate School, and Norton Middle School.
Ownership History
Date
Name
Owned For
Owner Type
Purchase Details
Closed on
May 23, 2001
Sold by
Tiburzio Benjamin J
Bought by
Ross James W and Ross Tamara A
Current Estimated Value
Home Financials for this Owner
Home Financials are based on the most recent Mortgage that was taken out on this home.
Original Mortgage
$123,982
Outstanding Balance
$46,980
Interest Rate
7.23%
Mortgage Type
FHA
Estimated Equity
$277,922
Purchase Details
Closed on
Apr 11, 2001
Sold by
Zag Samuel L and Zag Ann M
Bought by
Tiburzio Benjamin J
Home Financials for this Owner
Home Financials are based on the most recent Mortgage that was taken out on this home.
Original Mortgage
$123,982
Outstanding Balance
$46,980
Interest Rate
7.23%
Mortgage Type
FHA
Estimated Equity
$277,922
Purchase Details
Closed on
Aug 13, 1997
Sold by
Maronda Homes Inc
Bought by
Eag Samuel L and Eag Ann M
Create a Home Valuation Report for This Property
The Home Valuation Report is an in-depth analysis detailing your home's value as well as a comparison with similar homes in the area
Home Values in the Area
Average Home Value in this Area
Purchase History
| Date | Buyer | Sale Price | Title Company |
|---|---|---|---|
| Ross James W | $125,000 | Chicago Title | |
| Tiburzio Benjamin J | $118,100 | Benchmark Title Agency Inc | |
| Eag Samuel L | $113,900 | Chicago Title West |
Source: Public Records
Mortgage History
| Date | Status | Borrower | Loan Amount |
|---|---|---|---|
| Open | Ross James W | $123,982 |
Source: Public Records
Tax History Compared to Growth
Tax History
| Year | Tax Paid | Tax Assessment Tax Assessment Total Assessment is a certain percentage of the fair market value that is determined by local assessors to be the total taxable value of land and additions on the property. | Land | Improvement |
|---|---|---|---|---|
| 2024 | $3,462 | $94,960 | $26,250 | $68,710 |
| 2023 | $4,738 | $94,960 | $26,250 | $68,710 |
| 2022 | $2,674 | $54,780 | $6,580 | $48,200 |
| 2021 | $2,727 | $54,780 | $6,580 | $48,200 |
| 2020 | $2,712 | $54,780 | $6,580 | $48,200 |
| 2019 | $2,533 | $45,150 | $5,250 | $39,900 |
| 2018 | $2,511 | $45,150 | $5,250 | $39,900 |
| 2017 | $2,505 | $45,150 | $5,250 | $39,900 |
| 2016 | $2,501 | $41,340 | $8,020 | $33,320 |
| 2015 | $2,501 | $41,340 | $8,020 | $33,320 |
| 2014 | $2,504 | $41,340 | $8,020 | $33,320 |
| 2013 | $1,460 | $48,615 | $9,415 | $39,200 |
Source: Public Records
Map
Nearby Homes
- 429 Postle Blvd
- 110 Pasadena Ave
- 40 Gladys Rd
- 354 Fernhill Ave
- 5409 Longworth Dr
- 5728 Greendale Dr
- 264 Woodlawn Ave
- 477 Clairbrook Ave
- 417 Pamlico St Unit JK2
- 452 Pamlico St Unit 9
- 491 Clairbrook Ave Unit 3
- 515 Clairbrook Ave
- 5504 Inglecrest Place
- 542 Clairbrook Ave Unit 11
- 5006 Old Tree Ave
- 435 Redmond Rd
- 5824 Hunting Hollow Ct Unit 5824-5826
- 5722 Silver Spurs Ln
- 579 Simbury St Unit B9
- 5773 Sharets Dr
- 205 Charing Cross St
- 217 Charing Cross St
- 199 Charing Cross St
- 223 Charing Cross St
- 229 Charing Cross St
- 193 Charing Cross St
- 235 Charing Cross St
- 236 Charing Cross St
- 224 Charing Cross St
- 243 Charing Cross St
- 212 Charing Cross St
- 187 Charing Cross St
- 216 Creekside Plaza
- 200 Eastcreek Dr
- 224 Creekside Plaza
- 216 Eastcreek Dr
- 181 Charing Cross St
- 224 Eastcreek Dr
- 251 Charing Cross St
- 232 Eastcreek Dr